

The time-series graph in Figure 24 depicts the number of residents in the United States living in
Question:
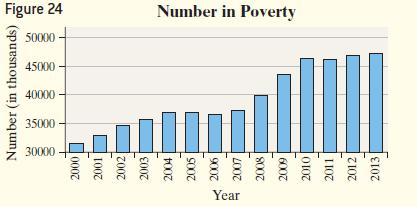
The time-series graph in Figure 24 depicts the number of residents in the United States living in poverty. Why might this graph be considered misrepresentative?
Approach Look for any characteristics that may mislead a reader, such as manipulation of the vertical scale.
Fantastic news! We've Found the answer you've been seeking!
Step by Step Answer:
The graph may mislead readers to believe that the number in poverty has more than doubled since 2007 ...View the full answer

Answered By
Utsab mitra
I have the expertise to deliver these subjects to college and higher-level students. The services would involve only solving assignments, homework help, and others.
I have experience in delivering these subjects for the last 6 years on a freelancing basis in different companies around the globe. I am CMA certified and CGMA UK. I have professional experience of 18 years in the industry involved in the manufacturing company and IT implementation experience of over 12 years.
I have delivered this help to students effortlessly, which is essential to give the students a good grade in their studies.
2+ Reviews
10+ Question Solved
Related Book For 

Statistics Informed Decisions Using Data
ISBN: 9781292157115
5th Global Edition
Authors: Michael Sullivan
Question Posted:
