

Form a correlation matrix and a variance-covariance matrix from the excess returns of the three stocks and
Fantastic news! We've Found the answer you've been seeking!
Question:
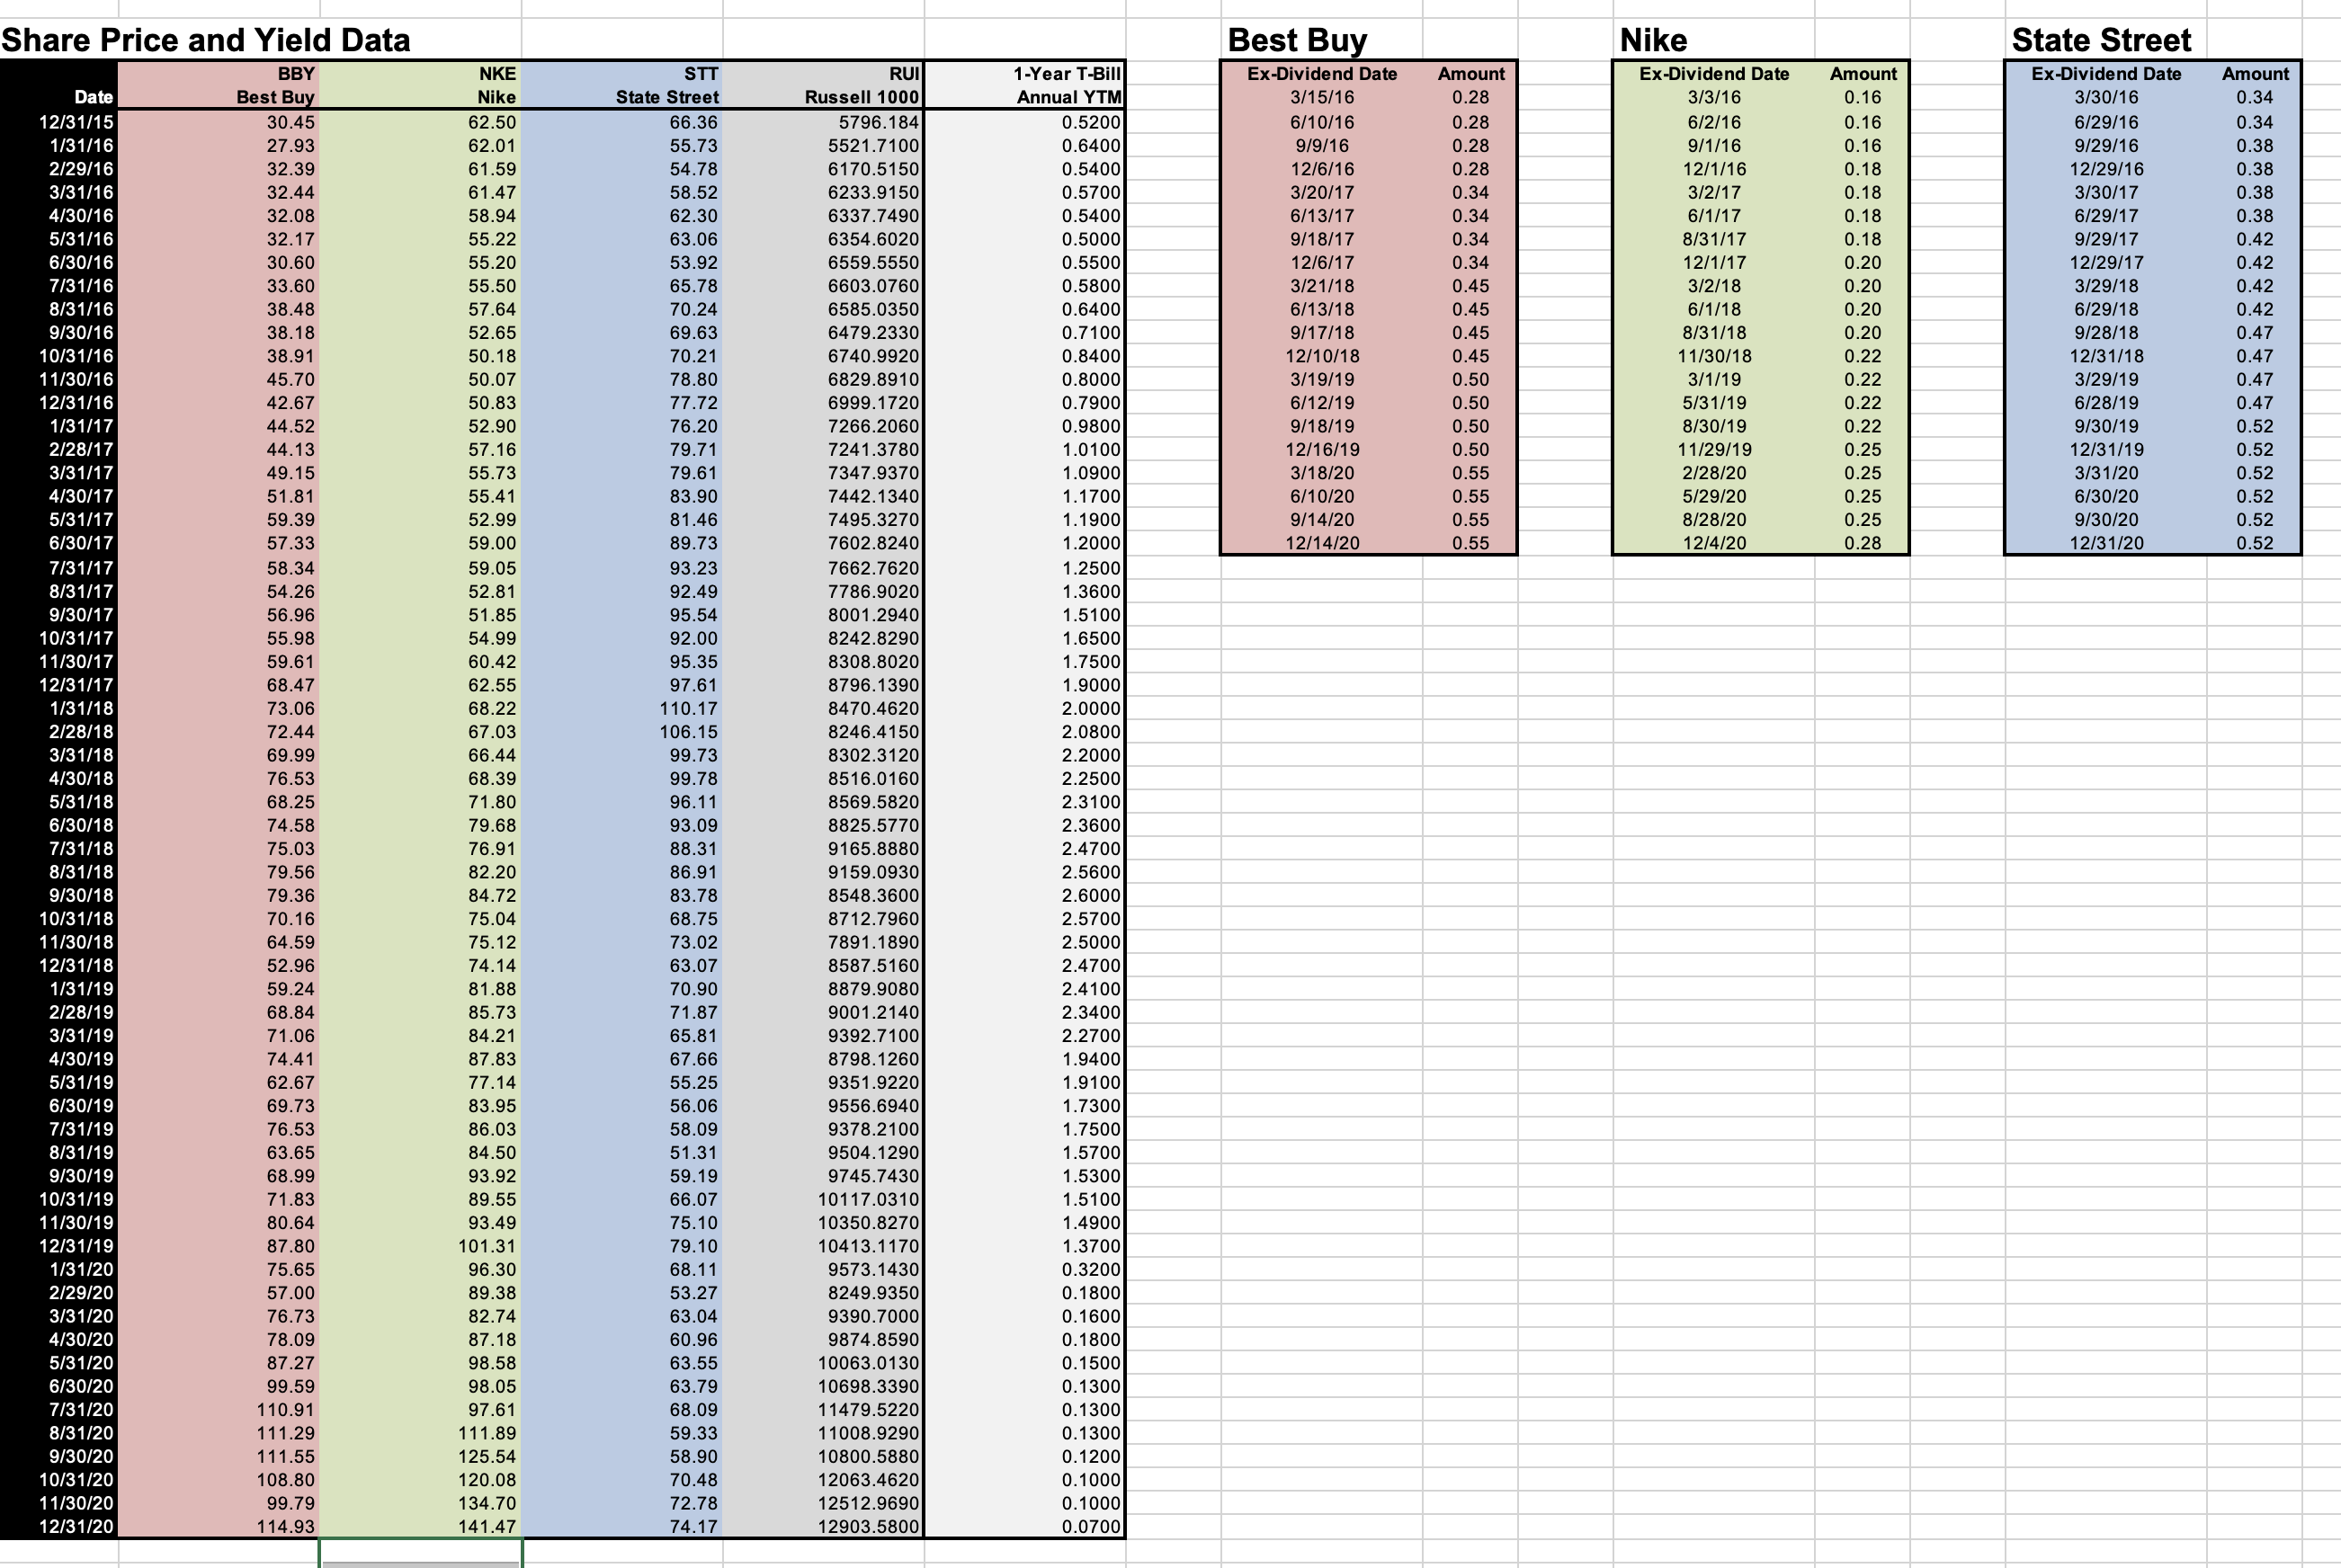
Form a correlation matrix and a variance-covariance matrix from the excess returns of the three stocks and the Russell 1000.
Calculate betas for all three of the stocks in two ways: (i) using the entries from the variance-covariance matrix, and (ii) using the SLOPE() function.
Link to Excel File: https://docs.google.com/spreadsheets/d/1WjtfWuJuzDOWiXEtrpEaItooKOGvXF4NyGtjnJDpKbU/edit#gid=0
Expert Answer:
To form the correlation matrix and variancecovariance matrix and calculate the betas for the three stocks I will use the following steps 1 Calculate the Excess Returns The excess return for each stock ... View the full answer

Related Book For 

Posted Date:
