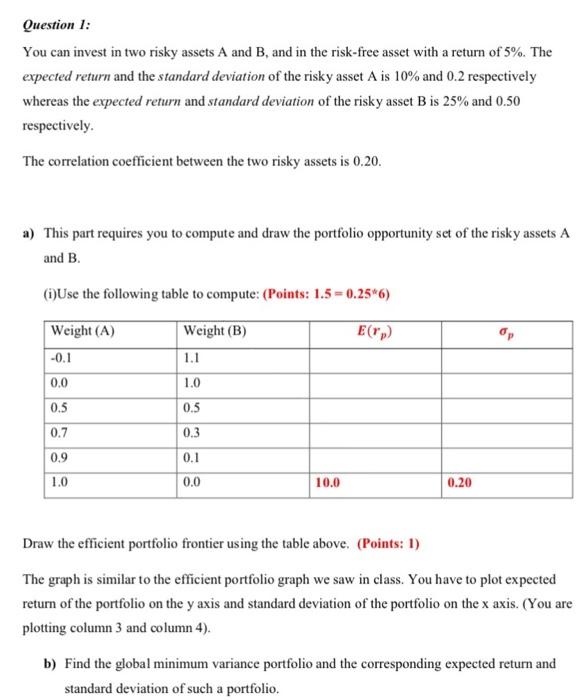
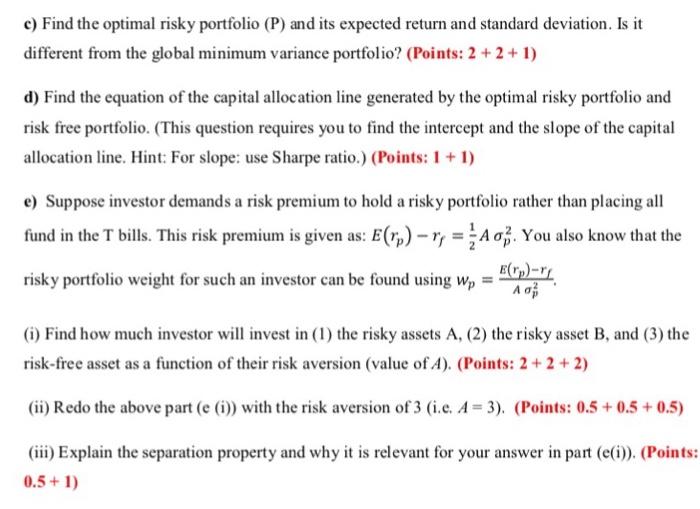
Question 1: You can invest in two risky assets A and B, and in the risk-free...
Fantastic news! We've Found the answer you've been seeking!
Question:
Transcribed Image Text:
Question 1: You can invest in two risky assets A and B, and in the risk-free asset with a return of 5%. The expected return and the standard deviation of the risky asset A is 10% and 0.2 respectively whereas the expected return and standard deviation of the risky asset B is 25% and 0.50 respectively. The correlation coefficient between the two risky assets is 0.20. a) This part requires you to compute and draw the portfolio opportunity set of the risky assets A and B. (i)Use the following table to compute: (Points: 1.5-0.25*6) Weight (A) Weight (B) -0.1 1.1 0.0 1.0 0.5 0.5 0.7 0.3 0.9 0.1 1.0 0.0 10.0 E(rp) 0.20 Draw the efficient portfolio frontier using the table above. (Points: 1) The graph is similar to the efficient portfolio graph we saw in class. You have to plot expected return of the portfolio on the y axis and standard deviation of the portfolio on the x axis. (You are plotting column 3 and column 4). b) Find the global minimum variance portfolio and the corresponding expected return and standard deviation of such a portfolio. c) Find the optimal risky portfolio (P) and its expected return and standard deviation. Is it different from the global minimum variance portfolio? (Points: 2 + 2 + 1) d) Find the equation of the capital allocation line generated by the optimal risky portfolio and risk free portfolio. (This question requires you to find the intercept and the slope of the capital allocation line. Hint: For slope: use Sharpe ratio.) (Points: 1 + 1) e) Suppose investor demands a risk premium to hold a risky portfolio rather than placing all fund in the T bills. This risk premium is given as: E(rp)-r=Ao. You also know that the risky portfolio weight for such an investor can be found using Wp = E(rp)-rf Ad (i) Find how much investor will invest in (1) the risky assets A, (2) the risky asset B, and (3) the risk-free asset as a function of their risk aversion (value of 4). (Points: 2+2+2) (ii) Redo the above part (e (i)) with the risk aversion of 3 (i.c. A= 3). (Points: 0.5 +0.5 +0.5) (iii) Explain the separation property and why it is relevant for your answer in part (e(i)). (Points: 0.5 + 1) Question 1: You can invest in two risky assets A and B, and in the risk-free asset with a return of 5%. The expected return and the standard deviation of the risky asset A is 10% and 0.2 respectively whereas the expected return and standard deviation of the risky asset B is 25% and 0.50 respectively. The correlation coefficient between the two risky assets is 0.20. a) This part requires you to compute and draw the portfolio opportunity set of the risky assets A and B. (i)Use the following table to compute: (Points: 1.5-0.25*6) Weight (A) Weight (B) -0.1 1.1 0.0 1.0 0.5 0.5 0.7 0.3 0.9 0.1 1.0 0.0 10.0 E(rp) 0.20 Draw the efficient portfolio frontier using the table above. (Points: 1) The graph is similar to the efficient portfolio graph we saw in class. You have to plot expected return of the portfolio on the y axis and standard deviation of the portfolio on the x axis. (You are plotting column 3 and column 4). b) Find the global minimum variance portfolio and the corresponding expected return and standard deviation of such a portfolio. c) Find the optimal risky portfolio (P) and its expected return and standard deviation. Is it different from the global minimum variance portfolio? (Points: 2 + 2 + 1) d) Find the equation of the capital allocation line generated by the optimal risky portfolio and risk free portfolio. (This question requires you to find the intercept and the slope of the capital allocation line. Hint: For slope: use Sharpe ratio.) (Points: 1 + 1) e) Suppose investor demands a risk premium to hold a risky portfolio rather than placing all fund in the T bills. This risk premium is given as: E(rp)-r=Ao. You also know that the risky portfolio weight for such an investor can be found using Wp = E(rp)-rf Ad (i) Find how much investor will invest in (1) the risky assets A, (2) the risky asset B, and (3) the risk-free asset as a function of their risk aversion (value of 4). (Points: 2+2+2) (ii) Redo the above part (e (i)) with the risk aversion of 3 (i.c. A= 3). (Points: 0.5 +0.5 +0.5) (iii) Explain the separation property and why it is relevant for your answer in part (e(i)). (Points: 0.5 + 1)
Expert Answer:
Answer rating: 100% (QA)
a w A w B 01 11 00 05 Erp E w Er W Allocation of assets of optimal risky portfolio after optimizing ... View the full answer
Related Book For
Posted Date:
Students also viewed these accounting questions
-
What must be the beta of a portfolio with E( rP ) = 18%, if rf = 6% and E (rM) = 14%?
-
What is the beta of a portfolio with E(rP) = 20%, if rf =5% and E(rM) = 15%?
-
What is the beta of a portfolio with E( rp) = 18 percent, if rf = 6 percent and E( rM) =14 percent?
-
NIU Company's budgeted sales and direct materials purchases are as follows: NIU's sales are 40% cash and 60% credit. It collects credit sales 10% in the month of sale, 50% in the month following...
-
Polygraphs used in criminal investigations typically measure five bodily functions: (1) thoracic respiration, (2) abdominal respiration, (3) blood pressure and pulse rate, (4) muscular movement and...
-
Fan Base (FB) operates a megastore featuring sports merchandise. It uses an EOQ decision model to make inventory decisions. It is now consider ing inventory decisions for its Los Angeles Galaxy...
-
Do consumer products and services perform missions?
-
The production of a new product required Zion Manufacturing Co. to lease additional plant facilities. Based on studies, the following data have been made available: Estimated annual sales24,000 units...
-
7. How can organizations meet the special needs of different groups (e.g., work and family issues) without appearing to show favoritism? 8. How can diversity and inclusiveness give a company a...
-
Bartman Industries' and Reynolds Inc.'s stock prices and dividends, along with the Winslow 5000 Index, are shown here for the period 2006-2011. The Winslow 5000 data are adjusted to include...
-
parts 12 144-t2 Q4) You may use geometry for some of the following problem | Note Let G(x) = 144-t dt X graph -12 of (F(t)=144 +2 Find : (i) G(0), (ii) and the area (iii) G'(x), (iv) G (0) is a...
-
A metal rod has a Young's modulus of 200 x 10 N/m, a coefficient of linear expansion of 8.3 x 10⁶/C and an ultimate strength of 430 x 106 N/m. When it is at 25.0C it is bolted at both ends and then...
-
In a 6 5 m high waterfall, 5 . 0 x 1 0 5 m 3 of water flows over every 5 . 5 hours. 6 . 5 % of the flow is diverted into a Hydroelectric Generating Station that operates at 7 5 % efficiency. What...
-
10) Imagine a scenario as outlined below on a (surprise!) frictionless, massless pulley and rope system. If the us for the table top is 0.374, label all the forces appropriately and determine their...
-
Consider a large interferometer that uses a lazer with the wavelength of 1 , 1 2 0 . 9 1 nm ( 1 1 2 0 . 9 1 x 1 0 - 9 m ) . What is the frequency of the photons emitted by this beam in hertz? Express...
-
8) In the equation d = 1.58 (m/s)*t2 - 6.70 (m/s)*t + 0.75 (m), what is the acceleration of the object? What is the velocity of the object at t = 2.2 seconds? When is the velocity of the object zero?
-
3.) Briefly explain why market segmentation is necessary for an organization.
-
Refrigerant R-12 at 30C, 0.75 MPa enters a steady flow device and exits at 30C, 100 kPa. Assume the process is isothermal and reversible. Find the change in availability of the refrigerant.
-
Wall Street firms have traditionally compensated their traders with a share of the trading profits that they generated. How might this practice have affected traders willingness to assume risk? What...
-
If the simple CAPM is valid, which of the following situations are possible? Explain. Consider each situation independently. Standard Portfolio Expected Return Deviation 30 40 35 25
-
Small firms will have relatively high loadings (high betas) on the SMB (small minus big) factor. a. Explain why. b. Now suppose two unrelated small firms merge. Each will be operated as an...
-
The rotor shown in Fig. 9.44 (a) is balanced temporarily in a balancing machine by adding the masses \(m_{1}=m_{2}=90 \mathrm{~g}\) in the plane \(A\) and \(m_{3}=m_{4}=90 \mathrm{~g}\) in the plane...
-
A turbine rotor is run at the natural frequency of the system. A stroboscope indicates that the maximum displacement of the rotor occurs at an angle \(229^{\circ}\) in the direction of rotation. At...
-
The cylinders of a four-cylinder in-line engine are placed at intervals of \(300 \mathrm{~mm}\) in the axial direction. The cranks have the same length, \(100 \mathrm{~mm}\), and their angular...
Study smarter with the SolutionInn App