

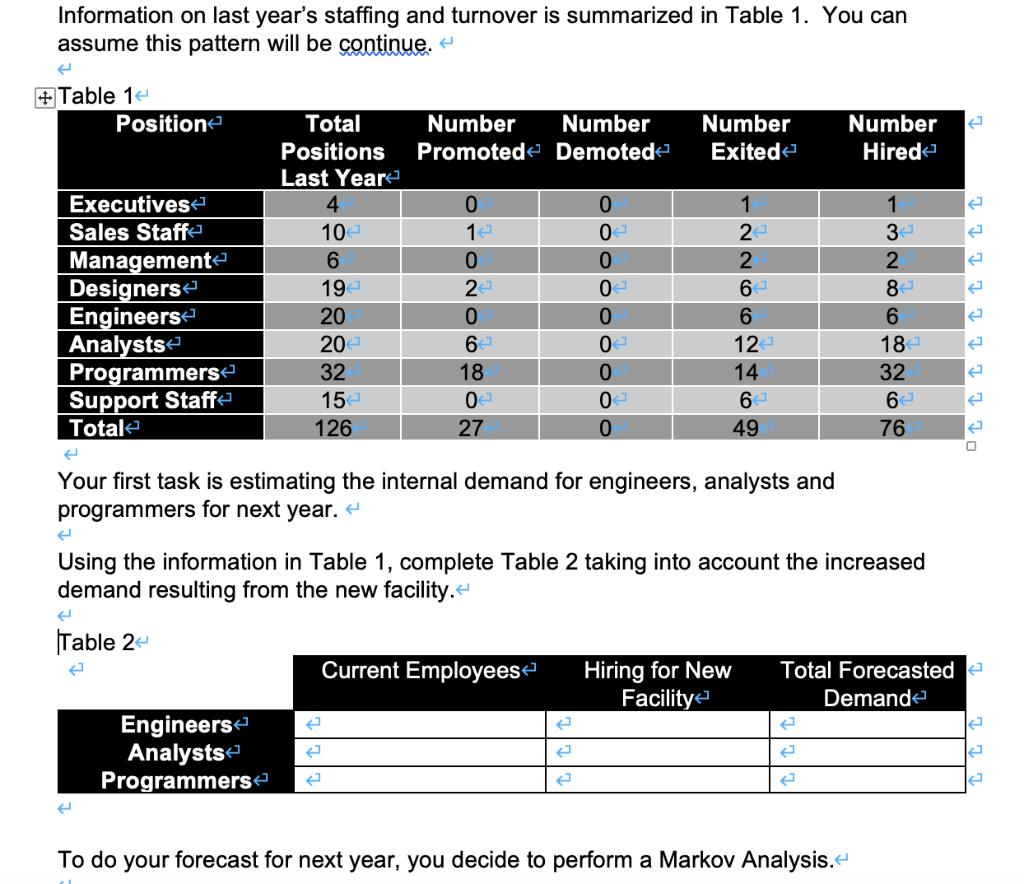
Information on last year's staffing and turnover is summarized in Table 1. You can assume this...
Fantastic news! We've Found the answer you've been seeking!
Question:

Transcribed Image Text:
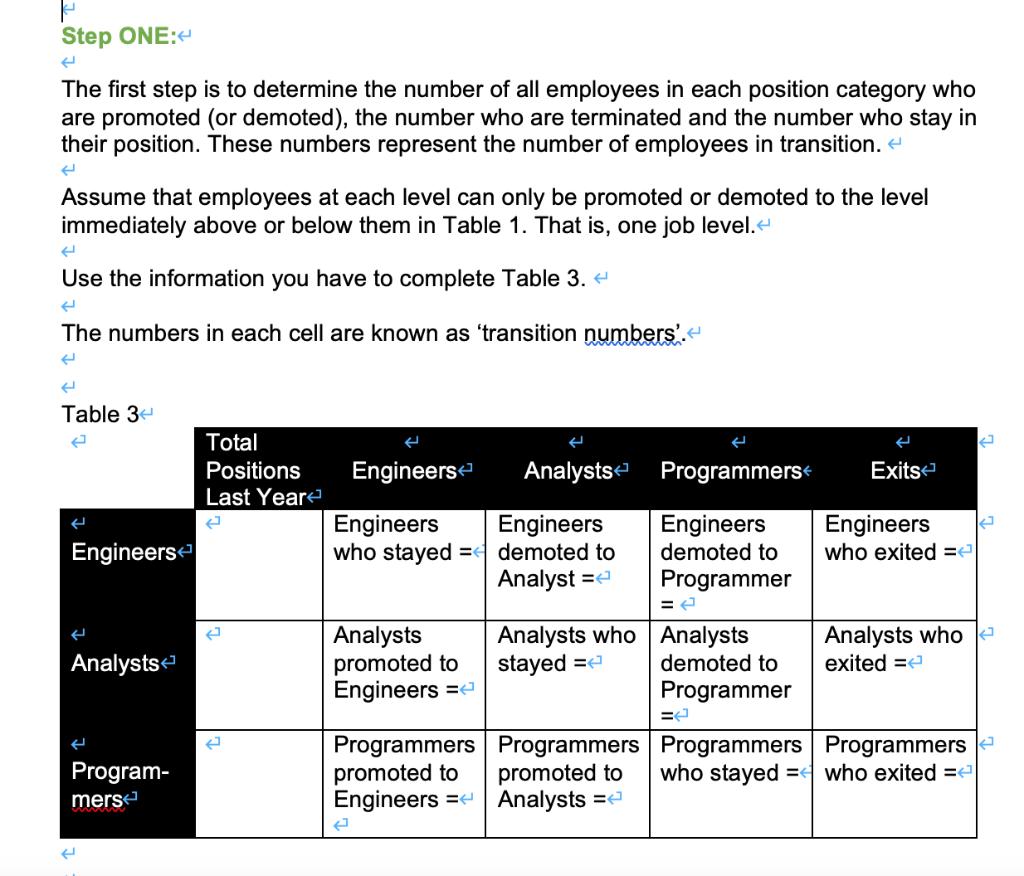
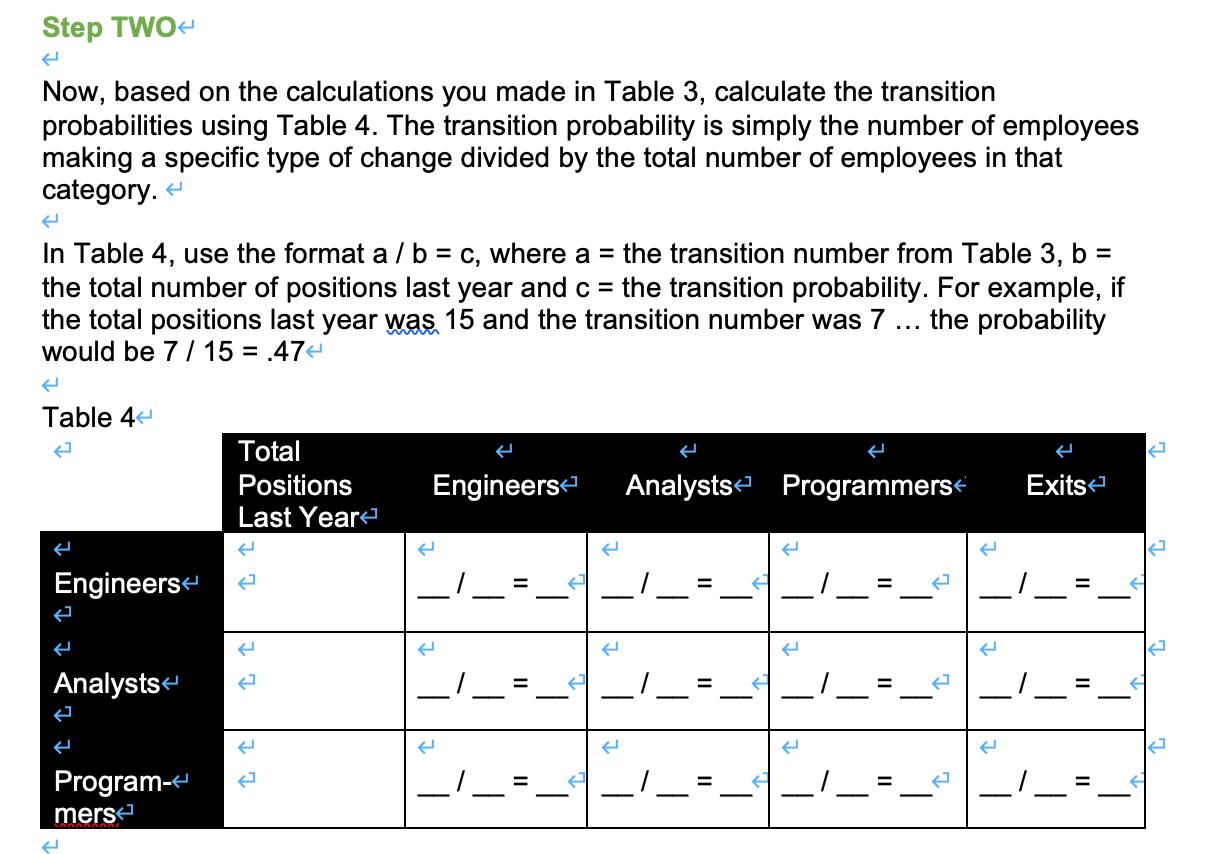
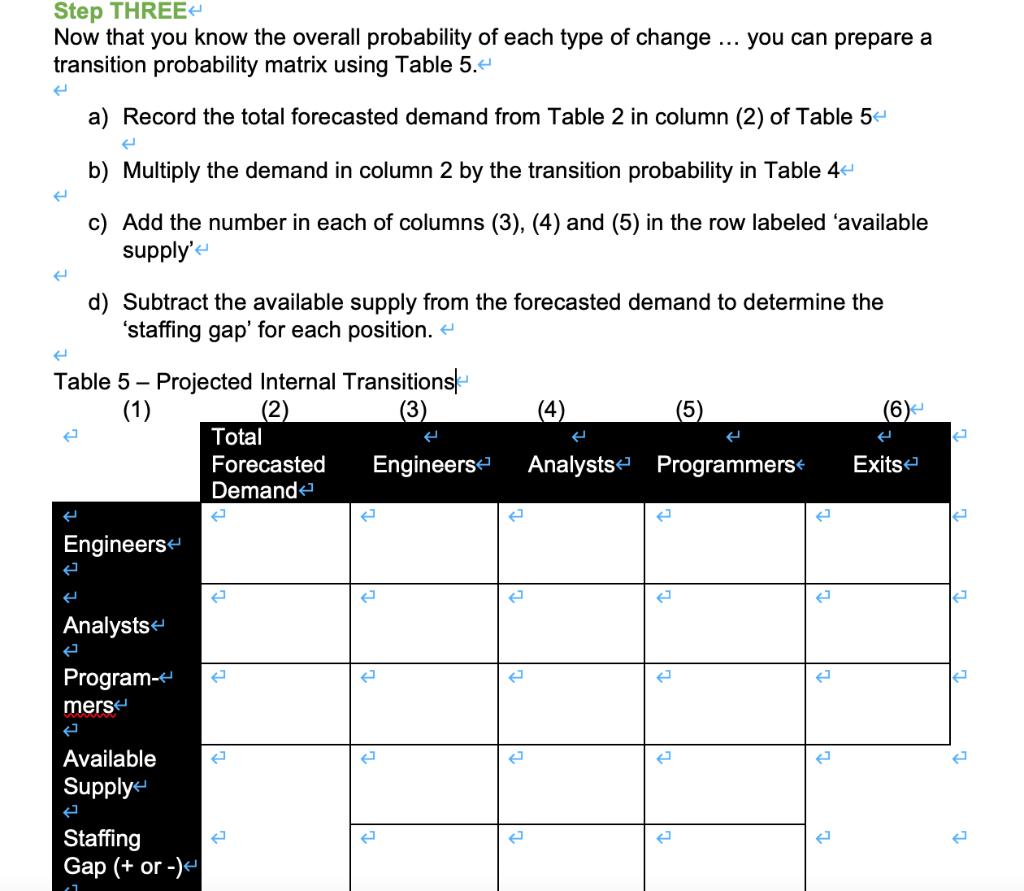
Information on last year's staffing and turnover is summarized in Table 1. You can assume this pattern will be continue. < +Table 14 Position Executives Sales Staff Management Designers Engineers Analysts Programmers Support Staff Total Total Positions Last Year 4 10€ 6 194¹ 20 20€ 32 15€ ( Table 24 126 Engineers Analysts Programmers Number Promoted 0 14 0 24 2 2 E 0 6€ 18 04 27 Number Number Demoted Exited Current Employees 0 0 0 0 0 0 0 0 0 1 Your first task is estimating the internal demand for engineers, analysts and programmers for next year. < P 2 1 20 2 6€ 6 124¹ 14 6€ 49 Hiring for New Facility Using the information in Table 1, complete Table 2 taking into account the increased demand resulting from the new facility.< Number Hired J P 1 34 2 To do your forecast for next year, you decide to perform a Markov Analysis.< 1868 84 18€ 32 64 76 Total Forecasted Demand 2 P ott t t L LLL 2 P 2 Step ONE:< e The first step is to determine the number of all employees in each position category who are promoted (or demoted), the number who are terminated and the number who stay in their position. These numbers represent the number of employees in transition. < Assume that employees at each level can only be promoted or demoted to the level immediately above or below them in Table 1. That is, one job level.< ( Use the information you have to complete Table 3. < ( The numbers in each cell are known as 'transition numbers'.< e ( Table 3 e Engineers ( Analysts Program- mers H Total Positions Last Year E E ← Engineers Analysts Engineers Engineers who stayed = demoted to Analyst =< Analysts promoted to Engineers = Programmers promoted to Engineers = J Analysts who stayed = Programmers promoted to Analysts = Programmers Engineers demoted to Programmer Analysts demoted to Programmer = Exits Engineers who exited = Analysts who exited = Programmers Programmers who stayed =< who exited = E 2 2 Step TWO< 4 Now, based on the calculations you made in Table 3, calculate the transition probabilities using Table 4. The transition probability is simply the number of employees making a specific type of change divided by the total number of employees in that category. < In Table 4, use the format a / b = c, where a = the transition number from Table 3, b = the total number of positions last year and c = the transition probability. For example, if the total positions last year was 15 and the transition number was 7 the probability would be 7 / 15 = .47< Table 4 ( Engineers له Analysts ( Program- mers ← Total Positions Last Year ( ← L F Engineers N N K ... Analysts Programmers N N | 2 T Exits II 11 E ← 2 Step THREE Now that you know the overall probability of each type of change. you can prepare a transition probability matrix using Table 5.< E ( E E a) Record the total forecasted demand from Table 2 in column (2) of Table 5 ( ( Table 5 - Projected Internal Transitions (1) (3) Engineers 2 b) Multiply the demand in column 2 by the transition probability in Table 4 c) Add the number in each of columns (3), (4) and (5) in the row labeled 'available supply' Engineers d) Subtract the available supply from the forecasted demand to determine the 'staffing gap' for each position. < Analysts Program- mers Available Supply Staffing Gap (+ or -)< Total Forecasted Demand J 2 ← ( C 2 2 ... 2 (4) e Analysts Programmers 2 2 V E Exits Step FOUR Based on the above analysis, summarize your conclusions. What would you tell your client? And, considering the current external environment, what additional observations or recommendations would you make? < Information on last year's staffing and turnover is summarized in Table 1. You can assume this pattern will be continue. < +Table 14 Position Executives Sales Staff Management Designers Engineers Analysts Programmers Support Staff Total Total Positions Last Year 4 10€ 6 194¹ 20 20€ 32 15€ ( Table 24 126 Engineers Analysts Programmers Number Promoted 0 14 0 24 2 2 E 0 6€ 18 04 27 Number Number Demoted Exited Current Employees 0 0 0 0 0 0 0 0 0 1 Your first task is estimating the internal demand for engineers, analysts and programmers for next year. < P 2 1 20 2 6€ 6 124¹ 14 6€ 49 Hiring for New Facility Using the information in Table 1, complete Table 2 taking into account the increased demand resulting from the new facility.< Number Hired J P 1 34 2 To do your forecast for next year, you decide to perform a Markov Analysis.< 1868 84 18€ 32 64 76 Total Forecasted Demand 2 P ott t t L LLL 2 P 2 Step ONE:< e The first step is to determine the number of all employees in each position category who are promoted (or demoted), the number who are terminated and the number who stay in their position. These numbers represent the number of employees in transition. < Assume that employees at each level can only be promoted or demoted to the level immediately above or below them in Table 1. That is, one job level.< ( Use the information you have to complete Table 3. < ( The numbers in each cell are known as 'transition numbers'.< e ( Table 3 e Engineers ( Analysts Program- mers H Total Positions Last Year E E ← Engineers Analysts Engineers Engineers who stayed = demoted to Analyst =< Analysts promoted to Engineers = Programmers promoted to Engineers = J Analysts who stayed = Programmers promoted to Analysts = Programmers Engineers demoted to Programmer Analysts demoted to Programmer = Exits Engineers who exited = Analysts who exited = Programmers Programmers who stayed =< who exited = E 2 2 Step TWO< 4 Now, based on the calculations you made in Table 3, calculate the transition probabilities using Table 4. The transition probability is simply the number of employees making a specific type of change divided by the total number of employees in that category. < In Table 4, use the format a / b = c, where a = the transition number from Table 3, b = the total number of positions last year and c = the transition probability. For example, if the total positions last year was 15 and the transition number was 7 the probability would be 7 / 15 = .47< Table 4 ( Engineers له Analysts ( Program- mers ← Total Positions Last Year ( ← L F Engineers N N K ... Analysts Programmers N N | 2 T Exits II 11 E ← 2 Step THREE Now that you know the overall probability of each type of change. you can prepare a transition probability matrix using Table 5.< E ( E E a) Record the total forecasted demand from Table 2 in column (2) of Table 5 ( ( Table 5 - Projected Internal Transitions (1) (3) Engineers 2 b) Multiply the demand in column 2 by the transition probability in Table 4 c) Add the number in each of columns (3), (4) and (5) in the row labeled 'available supply' Engineers d) Subtract the available supply from the forecasted demand to determine the 'staffing gap' for each position. < Analysts Program- mers Available Supply Staffing Gap (+ or -)< Total Forecasted Demand J 2 ← ( C 2 2 ... 2 (4) e Analysts Programmers 2 2 V E Exits Step FOUR Based on the above analysis, summarize your conclusions. What would you tell your client? And, considering the current external environment, what additional observations or recommendations would you make? <
Expert Answer:
Answer rating: 100% (QA)
ANSWER My analysis and recommendations Step One Completing the Transition Numbers in Table 3 Engineers Engineers who stayed 20 0 0 6 14 Analysts promo... View the full answer

Related Book For 

Foundations of Lodging Management
ISBN: 978-0132560894
2nd edition
Authors: David K. Hayes, Jack D. Ninemeier, Allisha A. Miller.
Posted Date:
Students also viewed these human resource management questions
-
suppose Southern Mechanics has different demand forecast as follows: Please develop aggregate plan Forecast 1 2 3 4 5 6 Total 14 150 200 350 400 500/200 1,800
-
Will you be hiring employees during your first year of operations? If so, name their positions and describe the required qualifications, anticipated compensation, and how they will help your business.
-
As a graduate researcher working for the Asian Bank, you are assigned the task of estimating the following model of per capita income (incpc) on average years of education of residents of a country...
-
One end of a light, elastic string, of natural length 1.2m and modulus of elasticity 32N, is attached to a fixed point, B. A particle, P, of mass 1.5 kg, is then attached to the other end of the...
-
1. Why do you think Etienne Whites ideas were unsuccessful? 2. Did Etienne perceive the workers needs in the same way that they themselves did? She was attempting to use which needs as motivators?...
-
Identify the type of curve and sketch the graph. Do not plot points. Just use the standard graphs given in Figures 5, 6, 8, 10, and 11 and shift if necessary. x 2 + 4y 2 = 16 (-x, v) (x, v) y = ax,...
-
This case is a continuation of the Burburr Resorts & Hotels Corporation serial case that began in Chapter 1. The components of the Burburr serial case can be completed in any order. The Las Vegas...
-
Suppose that two Japanese companies, Hitachi and Toshiba, are the sole producers (i.e., duopolists) of a microprocessor chip used in a number of different brands of personal computers. Assume that...
-
Suppose that the supply curve of serving in the military is S(P) = P, where Q = S(P) is several hours employed in military service a day. There are only mercenaries in the army (there is no draft). P...
-
Complete Form SS-4 for TCLH Industries. The company was formed on December 1, 2019, as a corporation (which files Form 1120S and was incorporated in North Carolina) by Michael Sierra (CEO; SSN 232-...
-
E. Bertrand Model with Lowest Price Guarantee/Price Match (5 points) Take the two firms in our previous Bertrand model as Staples and Bestbuy. They are selling the same HP printer model, with the...
-
Why do markets fail? Discuss the importance of equity in economic and judicial decisions.
-
All problems of LP seek to maximize or minimize some quantity, usually profit or cost. a. True b. False
-
Why do nations trade? Explain why freer international trade welfare is- enhancing. Show and explain why trade theories have influenced the evolution and interpretation of international laws.
-
Some of the costs are minimised by the use of inventory. Which one is not affected by it? a. cost of purchasing items b. cost of advertisement c. cost of carrying or holding inventory d. cost of...
-
Which of the following would cause a change in the feasible region? a. Increasing an objective function coefficient in a maximization problem b. Adding a redundant constraint c. Changing the...
-
Describe why association rules and classification rules are not the same? Give examples. Why FP-Tree algorithm is usually faster than Apriori? Give some intuitive explanation. List at least four...
-
Open Text Corporation provides a suite of business information software products. Exhibit 10-9 contains Note 10 from the companys 2013 annual report detailing long-term debt. Required: a. Open Text...
-
Not all hotel owners enter into franchise agreements. Why do you think a hotel owner might choose not to affiliate with a franchise brand?
-
What factors would you consider in deciding whether your hotel should purchase and then rent audiovisual equipment (e.g., a digital projector and screen or specialized video conferencing equipment)...
-
There are numerous tasks that servers must perform in order to make their guests' dining experience a memorable one. What are some basics you would use as a hotel restaurant manager to train new...
-
The Russian mathematician Ladislaus Bortkiewicz noted that the Poisson distribution would apply to low-frequency events in a large population, even when the probabilities for individuals in the...
-
The number of claims received by an insurance company during a week follows a Poisson ( ) distribution. The weekly number of claims observed over a ten week period are: \(5,8,4,6,11,6,6,5,6,4\). (a)...
-
The number of particles emitted by a radioactive source during a ten second interval has the Poisson( ) distribution. The radioactive source is observed over ve non-overlapping intervals of ten...

Study smarter with the SolutionInn App