

Starbucks has a large, global supply chain that must efficiently supply over 17,000 stores. Although the...
Fantastic news! We've Found the answer you've been seeking!
Question:
Transcribed Image Text:
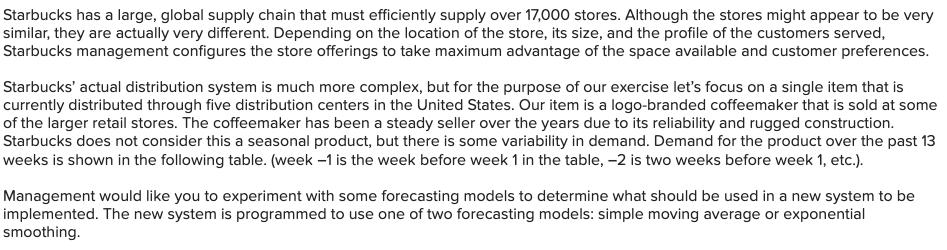
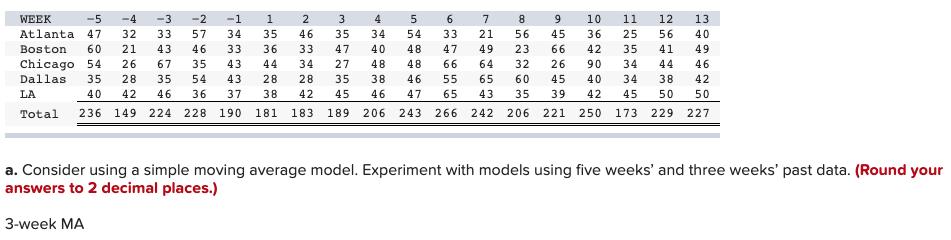
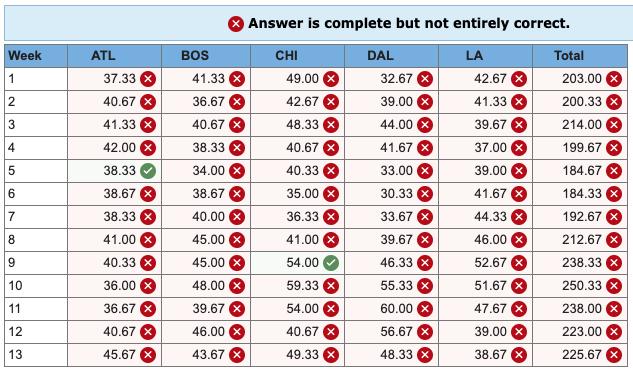
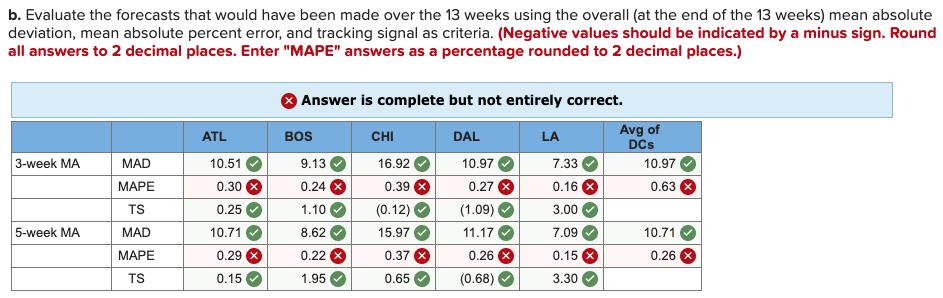
Starbucks has a large, global supply chain that must efficiently supply over 17,000 stores. Although the stores might appear to be very similar, they are actually very different. Depending on the location of the store, its size, and the profile of the customers served, Starbucks management configures the store offerings to take maximum advantage of the space available and customer preferences. Starbucks' actual distribution system is much more complex, but for the purpose of our exercise let's focus on a single item that is currently distributed through five distribution centers in the United States. Our item is a logo-branded coffeemaker that is sold at some of the larger retail stores. The coffeemaker has been a steady seller over the years due to its reliability and rugged construction. Starbucks does not consider this a seasonal product, but there is some variability in demand. Demand for the product over the past 13 weeks is shown in the following table. (week -1 is the week before week 1 in the table, -2 is two weeks before week 1, etc.). Management would like you to experiment with some forecasting models to determine what should be used in a new system to be implemented. The new system is programmed to use one of two forecasting models: simple moving average or exponential smoothing. -5 -4 -3 322 WEEK -2 -1 1 2 3 4 7 8 9 10 11 12 13 32 33 57 45 36 25 56 40 Atlanta 47 Boston 34 35 46 35 34 54 33 21 43 46 33 36 60 21 33 47 66 42 35 49 Chicago 54 26 67 35 40 48 47 49 23 44 34 27 48 43 28 28 43 48 66 64 32 26 90 34 44 46 Dallas. 35 28 35 54 35 38 46 55 65 60 45 40 34 38 42 LA 40 42 46 36 37 38. 42 45 46 47 65 43 35 39 42 45 50 50 Total 236 149 224 228 190 181 183. 189 206 243 266 242 206 221 250 173. 229 227 a. Consider using a simple moving average model. Experiment with models using five weeks' and three weeks' past data. (Round your answers to 2 decimal places.) 3-week MA Im لیا لیا wor 27 10 VA 564 NW ∞ WNA W w 5775 3443 00 00 5 5010 44 885 63 3465 246 45 53 6 1030 56 96 4624 1233 15 DA WAASH SOFT9N 14 41 ليا - Week 1 2 3 4 5 6 7 8 9 10 11 12 13 ATL 37.33 X 40.67 X 41.33 X 42.00 38.33 38.67 38.33 41.00 X 40.33 36.00 X 36.67 X 40.67 X 45.67 BOS 41.33 36.67 X 40.67 38.33 34.00 X 38.67 40.00 45.00 X 45.00 48.00 39.67 46.00 X 43.67 Answer is complete but not entirely correct. CHI DAL LA Total 49.00 X 42.67 42.67 X 41.33 X 48.33 X 39.67 X 40.67 X 37.00 X 40.33 X 39.00 X 35.00 X 41.67 X 36.33 X 44.33 41.00 X 46.00 54.00 52.67 59.33 X 51.67 X 54.00 X 47.67 X 40.67 X 39.00 X 49.33 38.67 X 32.67 39.00 X 44.00 X 41.67 X 33.00 x 30.33 X 33.67 39.67 46.33 55.33 X 60.00x 56.67 X 48.33 203.00 200.33 X 214.00 199.67 X 184.67 X 184.33 192.67 212.67 238.33 X 250.33 X 238.00 X 223.00 X 225.67 Week 1 2 3 4 5 6 7 8 9 10 11 12 13 ATL 40.60 38.20 41.00 41.40 36.80 40.80 40.40 35.40 39.60 41.80 38.20 36.60 43.60 BOS 40.60 35.80 39.20 39.00 37.80 40.80 43.00 46.20 41.40 46.60 45.40 43.00 41.40 CHI 45.00 43.00 44.60 36.60 39.20 40.20 44.60 50.60 51.60 47.20 55.60 49.20 45.20 DAL 39.00 37.60 37.60 37.60 34.40 35.00 40.40 47.80 52.80 54.20 53.00 48.80 43.40 LA 40.20 39.80 39.80 39.60 41.60 43.60 49.00 49.20 47.20 45.80 44.80 40.80 42.20 Total 205.40 194.40 201.20 194.20 189.80 200.40 217.40 229.20 232.60 235.60 237.00 218.40 215.80 b. Evaluate the forecasts that would have been made over the 13 weeks using the overall (at the end of the 13 weeks) mean absolute deviation, mean absolute percent error, and tracking signal as criteria. (Negative values should be indicated by a minus sign. Round all answers to 2 decimal places. Enter "MAPE" answers as a percentage rounded to 2 decimal places.) Answer is complete but not entirely correct. Avg of ATL BOS CHI DAL LA DCS 3-week MA MAD MAPE TS 5-week MA MAD MAPE TS 10.51 0.30 0.25 10.71 0.29 0.15 9.13 0.24 X 1.10 8.62 0.22 X 1.95 16.92 0.39 X (0.12) 15.97 0.37 0.65 10.97 0.27 (1.09) 11.17 0.26 X (0.68) 7.33 0.16 3.00 7.09 0.15 3.30 10.97 0.63 10.71 0.26 X Starbucks has a large, global supply chain that must efficiently supply over 17,000 stores. Although the stores might appear to be very similar, they are actually very different. Depending on the location of the store, its size, and the profile of the customers served, Starbucks management configures the store offerings to take maximum advantage of the space available and customer preferences. Starbucks' actual distribution system is much more complex, but for the purpose of our exercise let's focus on a single item that is currently distributed through five distribution centers in the United States. Our item is a logo-branded coffeemaker that is sold at some of the larger retail stores. The coffeemaker has been a steady seller over the years due to its reliability and rugged construction. Starbucks does not consider this a seasonal product, but there is some variability in demand. Demand for the product over the past 13 weeks is shown in the following table. (week -1 is the week before week 1 in the table, -2 is two weeks before week 1, etc.). Management would like you to experiment with some forecasting models to determine what should be used in a new system to be implemented. The new system is programmed to use one of two forecasting models: simple moving average or exponential smoothing. -5 -4 -3 322 WEEK -2 -1 1 2 3 4 7 8 9 10 11 12 13 32 33 57 45 36 25 56 40 Atlanta 47 Boston 34 35 46 35 34 54 33 21 43 46 33 36 60 21 33 47 66 42 35 49 Chicago 54 26 67 35 40 48 47 49 23 44 34 27 48 43 28 28 43 48 66 64 32 26 90 34 44 46 Dallas. 35 28 35 54 35 38 46 55 65 60 45 40 34 38 42 LA 40 42 46 36 37 38. 42 45 46 47 65 43 35 39 42 45 50 50 Total 236 149 224 228 190 181 183. 189 206 243 266 242 206 221 250 173. 229 227 a. Consider using a simple moving average model. Experiment with models using five weeks' and three weeks' past data. (Round your answers to 2 decimal places.) 3-week MA Im لیا لیا wor 27 10 VA 564 NW ∞ WNA W w 5775 3443 00 00 5 5010 44 885 63 3465 246 45 53 6 1030 56 96 4624 1233 15 DA WAASH SOFT9N 14 41 ليا - Week 1 2 3 4 5 6 7 8 9 10 11 12 13 ATL 37.33 X 40.67 X 41.33 X 42.00 38.33 38.67 38.33 41.00 X 40.33 36.00 X 36.67 X 40.67 X 45.67 BOS 41.33 36.67 X 40.67 38.33 34.00 X 38.67 40.00 45.00 X 45.00 48.00 39.67 46.00 X 43.67 Answer is complete but not entirely correct. CHI DAL LA Total 49.00 X 42.67 42.67 X 41.33 X 48.33 X 39.67 X 40.67 X 37.00 X 40.33 X 39.00 X 35.00 X 41.67 X 36.33 X 44.33 41.00 X 46.00 54.00 52.67 59.33 X 51.67 X 54.00 X 47.67 X 40.67 X 39.00 X 49.33 38.67 X 32.67 39.00 X 44.00 X 41.67 X 33.00 x 30.33 X 33.67 39.67 46.33 55.33 X 60.00x 56.67 X 48.33 203.00 200.33 X 214.00 199.67 X 184.67 X 184.33 192.67 212.67 238.33 X 250.33 X 238.00 X 223.00 X 225.67 Week 1 2 3 4 5 6 7 8 9 10 11 12 13 ATL 40.60 38.20 41.00 41.40 36.80 40.80 40.40 35.40 39.60 41.80 38.20 36.60 43.60 BOS 40.60 35.80 39.20 39.00 37.80 40.80 43.00 46.20 41.40 46.60 45.40 43.00 41.40 CHI 45.00 43.00 44.60 36.60 39.20 40.20 44.60 50.60 51.60 47.20 55.60 49.20 45.20 DAL 39.00 37.60 37.60 37.60 34.40 35.00 40.40 47.80 52.80 54.20 53.00 48.80 43.40 LA 40.20 39.80 39.80 39.60 41.60 43.60 49.00 49.20 47.20 45.80 44.80 40.80 42.20 Total 205.40 194.40 201.20 194.20 189.80 200.40 217.40 229.20 232.60 235.60 237.00 218.40 215.80 b. Evaluate the forecasts that would have been made over the 13 weeks using the overall (at the end of the 13 weeks) mean absolute deviation, mean absolute percent error, and tracking signal as criteria. (Negative values should be indicated by a minus sign. Round all answers to 2 decimal places. Enter "MAPE" answers as a percentage rounded to 2 decimal places.) Answer is complete but not entirely correct. Avg of ATL BOS CHI DAL LA DCS 3-week MA MAD MAPE TS 5-week MA MAD MAPE TS 10.51 0.30 0.25 10.71 0.29 0.15 9.13 0.24 X 1.10 8.62 0.22 X 1.95 16.92 0.39 X (0.12) 15.97 0.37 0.65 10.97 0.27 (1.09) 11.17 0.26 X (0.68) 7.33 0.16 3.00 7.09 0.15 3.30 10.97 0.63 10.71 0.26 X
Expert Answer:
Answer rating: 100% (QA)
To evaluate the forecasts using the overall mean absolute deviation MAD mean absolu... View the full answer

Related Book For 

Operations and Supply Chain Management
ISBN: 978-0078024023
14th edition
Authors: F. Robert Jacobs, Richard Chase
Posted Date:
Students also viewed these accounting questions
-
The number of telemarketing centers in the United States has decreased in the past few years. Why has this occurred?
-
The transfer of real property is much more complex than the transfer of personal property. What could be done to simplify real property transactions?
-
a. Explain how a hedge fund manager might appear to be able to beat the market for several years, and yet have no privileged information whatsoever. b. The M ratio for a portfolio P is positive....
-
Given the following information, prepare a production report with materials added at the beginning and ending work in process inventory being 20% complete with regard to conversion costs. Costs to...
-
A description of 14 typical information processing routines is given here, along with 10 numbered segments from systems flowcharts (Figure). Match the flowcharting segments with the descriptions to...
-
Defendant Jamey Allen Reid was convicted in Circuit Court, Oconee County of second-degree attempted criminal sexual conduct with a minor. Defendant appealed and the Court of Appeals of South Carolina...
-
With reference to the previous exercise, assume that production has a normal distribution and obtain a \(99 \%\) confidence interval for the true mean production of the pilot process. Data From...
-
The internal rate of return method is used by Premier Construction Co. in analyzing a capital expenditure proposal that involves an investment of $41,575 and annual net cash flows of $12,500 for each...
-
In a cache and memory system with the following characteristics: Direct Mapped 16 KByte 32 Byte Cache Lines (Blocks) 32 bit addresses, byte addressable How many bits are the Tag, Index and Offset...
-
1. Prepare a payroll register for Mary's Luxury Travel for the week ended March 22, 20--. (In the Taxable Earnings/Unemployment Compensation column, enter the same amounts as in the Social Security...
-
1 Summary Develop a competitive AI for the game Mancala Demonstrate your understanding of the MiniMax search algorithm, alpha- beta pruning, and dynamic programming We will be using Python 3 so be...
-
Checks are processed more quickly by banks because of new regulations. Your Task. Business writing is more forceful when it uses active-voice verbs. Revise the following sentences so that verbs are...
-
Explain the purpose of recording budgetary amounts in the accounts.
-
How does the PSAB recommend the reporting entity be defined?
-
Where do psychologists work?
-
Where some operating segments operate at a loss and others are profitable, how is the problem of offsetting considered in applying the 10% guidelines for reporting?
-
Given the flow graph in Fig. P14.5, calculate the transfer function and the impulse response of the LTI system of the realization. Fig. P14.5. The FIR system for Problem 14.5. x[k] 0.1 2-1 0.2 V 0.4...
-
The following information is available for Partin Company: Sales $598,000 Sales Returns and Allowances 20,000 Cost of Goods Sold 398,000 Selling Expense 69,000 Administrative Expense 25,000 Interest...
-
RentR Cars is a multisite car rental company in the city. It is trying out a new return the car to the location most convenient for you policy to improve customer service. But this means that the...
-
Following are the process flow sequences for three products: A, B, and C. There are two bottleneck operations on the first leg and fourth leg marked with an X. Boxes represent processes, which may be...
-
Why would subcontractors for a government project want their activities on the critical path? Under what conditions would they try to avoid being on the critical path?
-
The English scores for a sample of 14 students Find the mean, the median, and the mode of the data, if possible. If any measure cannot be found or does not represent the center of the data, explain...
-
The salaries (in thousand dollars) of a sample of 10 employees Find the mean, the median, and the mode of the data, if possible. If any measure cannot be found or does not represent the center of the...
-
The durations (in minutes) of idle times at a factory in the last 10 months Find the mean, the median, and the mode of the data, if possible. If any measure cannot be found or does not represent the...

Study smarter with the SolutionInn App