

Temperature is the dependent variable because it varies with time. Graph time on the x-axis and temperature
No answer yet for this question.
Ask a Tutor
Question:
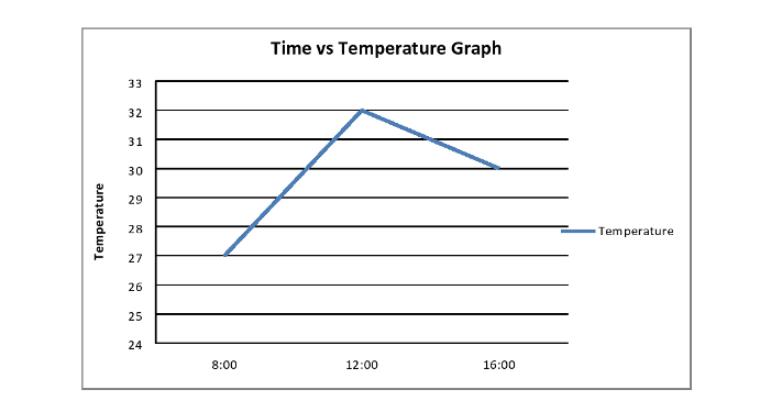
Temperature is the dependent variable because it varies with time. Graph time on the x-axis and temperature on the y-axis. Mark equal increments on the graph and include all measurements. Plot each point on the graph by finding the time on the x-axis and moving up until you find the recorded temperature on the y-axis. Continue placing points on the graph. Then, connect the points from left to right.
Time | Temp |
8:00 A.M. | 27°C |
12:00 P.M. | 32°C |
4:00 P.M. | 30°C |
Solve the Problem
1. Based on your graph, what was the temperature at 10:00 A.M.? What was the temperature at 2:00 P.M.?
2. What is the relationship between time and temperature?
3. Why is a line graph a useful tool in viewing this data?
4. For what other types of data might a line graph be useful?
Expert Answer:

Related Book For 

Posted Date:
