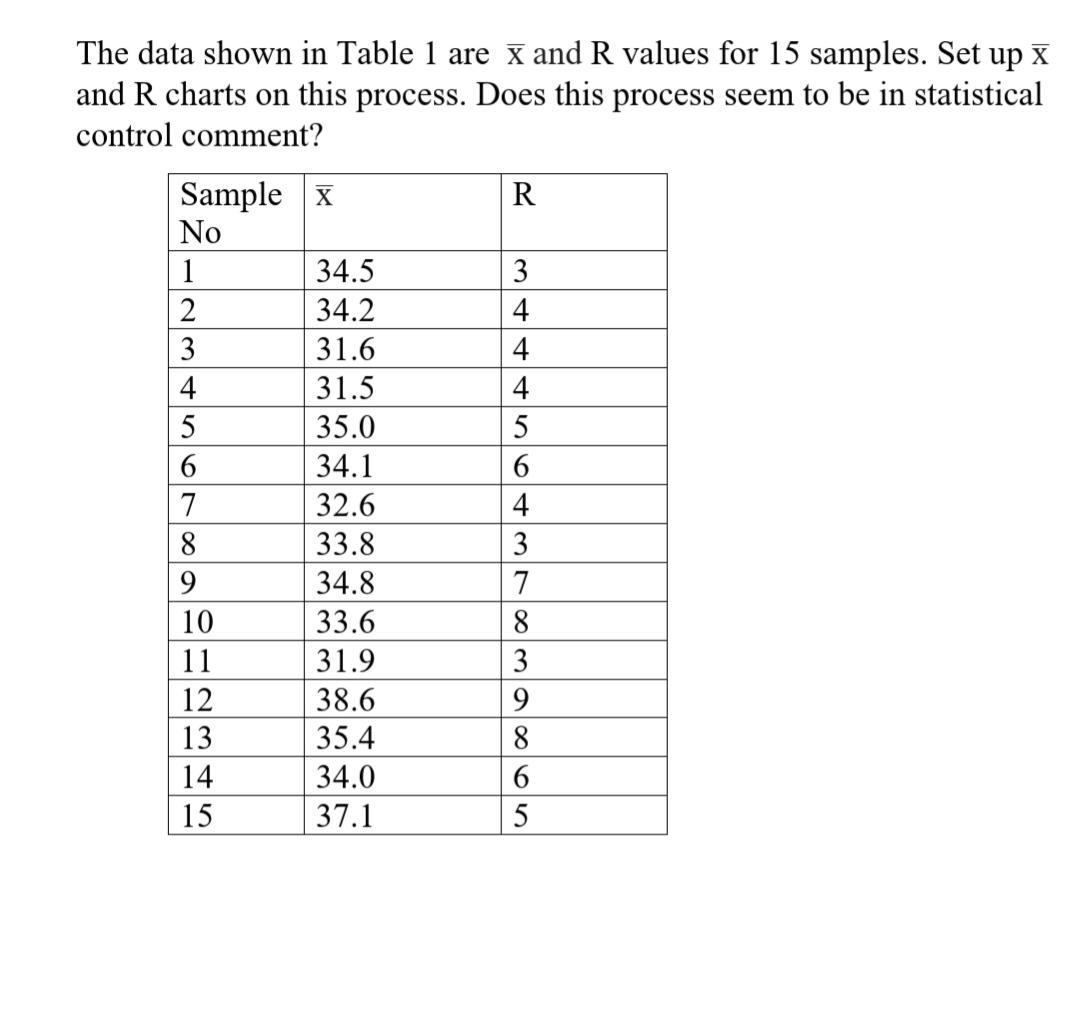
The data shown in Table 1 are x and R values for 15 samples. Set up...
Fantastic news! We've Found the answer you've been seeking!
Question:
Transcribed Image Text:
The data shown in Table 1 are x and R values for 15 samples. Set up x and R charts on this process. Does this process seem to be in statistical control comment? Sample x No R 1 34.5 3 34.2 4 3 31.6 4 4 31.5 4 5 35.0 5 6. 34.1 7 32.6 4 8. 33.8 3 9. 34.8 7 10 33.6 8. 11 31.9 3 12 38.6 9. 13 35.4 8 14 34.0 15 37.1 5 The data shown in Table 1 are x and R values for 15 samples. Set up x and R charts on this process. Does this process seem to be in statistical control comment? Sample x No R 1 34.5 3 34.2 4 3 31.6 4 4 31.5 4 5 35.0 5 6. 34.1 7 32.6 4 8. 33.8 3 9. 34.8 7 10 33.6 8. 11 31.9 3 12 38.6 9. 13 35.4 8 14 34.0 15 37.1 5
Expert Answer:
Related Book For
Introduction to Statistical Quality Control
ISBN: 978-1118146811
7th edition
Authors: Douglas C Montgomery
Posted Date:
Students also viewed these mechanical engineering questions
-
The data shown in Table 6E.2 are x and R values for 24 samples of size n = 5 taken from a process producing bearings. The measurements are made on the inside diameter of the bearing, with only the...
-
The data shown in Table 11.E1 come from a production process with two observable quality characteristics: x1 and x2. The data are sample means of each quality characteristic, based on samples of size...
-
The data shown in the following scatterplot show a very nice relationship between the two variables. However, the correlation here is 0.03, very close to zero. Explain why we can have a nice...
-
Terrance is a 13-year-old 8th grader, who is an average student. He is rarely ever disruptive in class and gets along well with his peers. His teacher always noticed that he was normally high-strung,...
-
Find the cost of goods sold and the cost of ending inventory using the LIFO method, the table in Exercise 1, and the fact that the ending inventory is 82 units. Date of purchase Beginning inventory...
-
Larcker Manufacturings cost accountant has provided you with the following information for January operations: Direct materials . . . . . . . . . . . . . . . . . . . . . . . . . . . . . . . . $21 per...
-
How can HRIS T&D applications help firms foster organizational learning?
-
As in Exercise 1, for each of the following situations, write the null and alternative hypotheses in terms of parameter values. a) A recent UMass-Amherst study found that seat-belt compliance in...
-
The one year interest rate over the next ten years will be: 5%, 6%, 7%, 8.5%, 9.5%, 10%, 10.5%, 11%, 12%, and 13%. Using the expectations theory, what will be the interest rates on a two -year bond,...
-
You are mapping metamorphic rocks and you notice a lineation within the rocks. At five different outcrops you measure the pitch of the lineation on an exposed planar rock surface (not necessarily the...
-
On 1 July 2022, Jack Ltd acquired some corporate bonds issued by McCoy Ltd. They had a 'face value of $2 million and offered a coupon rate of 10 % paid annually ($100,000 per year), paid on 30 June...
-
An economist believes that the percentage of the popular vote received by the incumbent partys candidate for president depends (negatively) on the unemployment rate and (negatively) on the rate of...
-
A study found that with simple regression equations, the increase in a human babys length during the first 3 months of life is negatively correlated with the babys length at birth and negatively...
-
An economist believes that housing construction depends (positively) on household income and (negatively) on interest rates. Having read only the chapter on simple regression, he regresses housing...
-
(continuation) We will use the model you estimated in question c of the preceding exercise to explain the sharp increase in stock prices in 1985 and 1986. a. Stock prices increased by 42.78 in 1985....
-
A dean claims that the salaries of humanities professors Y are determined solely by the number of years of teaching experience X. To see if there is a statistically significant difference in the...
-
The Least Connected Country on Earth MIS Eritrea, a nation of six million people, is located in eastern Africa, surrounded by Sudan, Ethiopia, and Djibouti. The country has been ruled by a...
-
United Business Forms capital structure is as follows: Debt ............................................ 35% Preferred stock ........................... 15 Common equity .......................... 50...
-
Thirty samples each of size 7 have been collected to establish control over a process. The following data were collected: (a) Calculate trial control limits for the two charts. (b) On the assumption...
-
Reconsider the insurance claim data in Table 7E.1. Set up an np control chart for this data and plot the data from Table 7E.1 on this chart. Compare this to the fraction nonconforming control chart...
-
Consider the p = 9 process variables in Table 11.5 (a) Perform a PCA on the first 30 observations. Be sure to work with the standardized variables. (b) How much variability is explained if only the...
-
Make a bar chart of \(\mathrm{CO}_{2}\) footprint divided by embodied energy, using data from the data sheets of Appendix A, Table A10, for a. Cement b. Low carbon steel c. Copper d....
-
a. Window frames are made from extruded aluminium. It is argued that making them instead from extruded PVC would give a product with a lower embodied energy and carbon footprint. If the section shape...
-
a. A range of office furniture includes a chunky hardwood table weighing \(18 \mathrm{~kg}\) and a much lighter table with a \(3.0 \mathrm{~kg}\) virgin aluminium frame and a \(3.0 \mathrm{~kg}\)...
Study smarter with the SolutionInn App