

The MakeupSales.xlsx file gives sales data for a small makeup company. Each row lists the salesperson, product
Question:
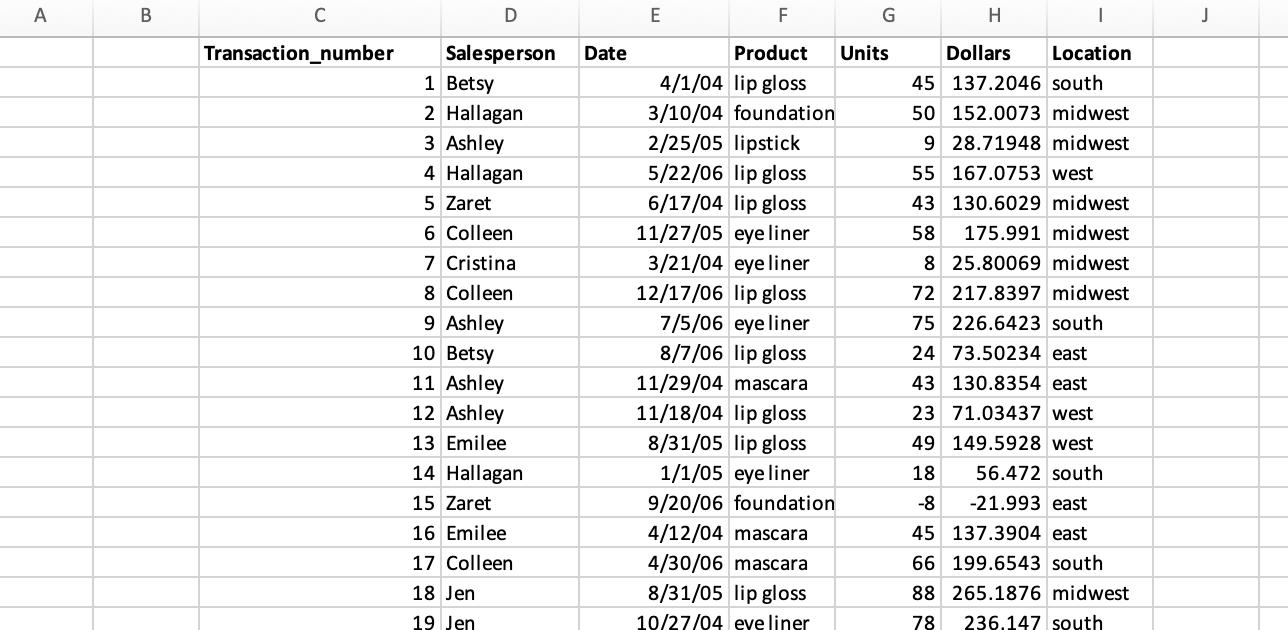
The MakeupSales.xlsx file gives sales data for a small makeup company. Each row lists the salesperson, product sold, location of the sale, units sold, and revenue generated. Use this file to perform the following exercises:
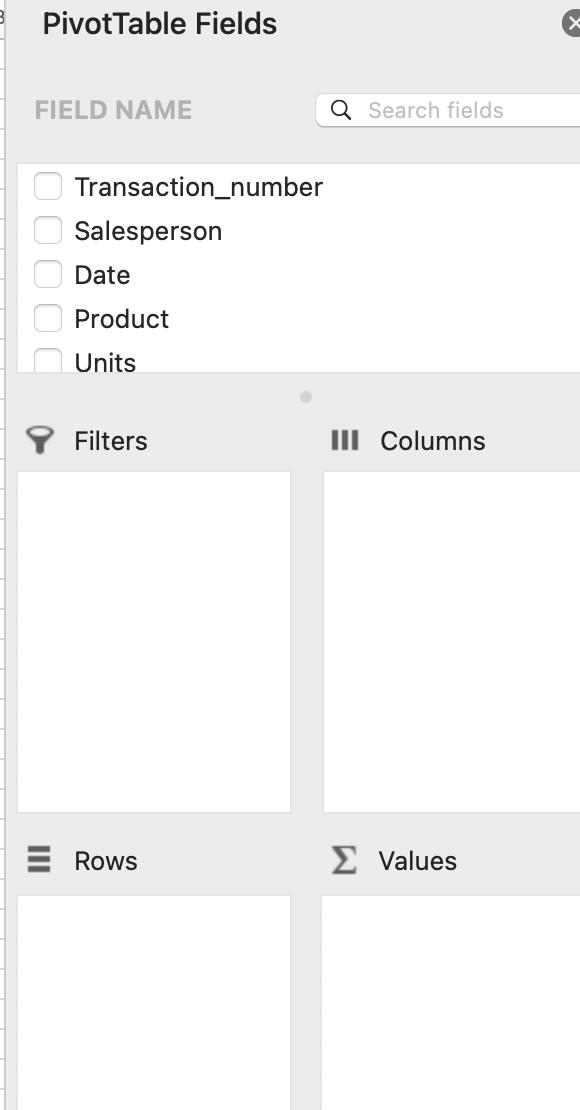
a. Create a combination chart involving a column and line graph with a secondary axis to chart the unit sales and dollar sales by location (east, Midwest, south, west). (Hint: first you have to use pivot table to get the sales by location. Then, create combination chart on that new table).
b. Use check boxes to set up a chart in which the user can choose which series are charted for Products eye liner, foundation, lip gloss, lipstick, mascara. (Hint: first you have to use pivot table to get the sales dollars by product. Then, create checkboxes, reference table, and chart on that new table).
c. Report descriptive statistics and correlation tables for product sales by each sales person (Hint: Summarize the total revenue sold by each person of each product using Pivot table - you did this in the assignment #1. Then, compute descriptive statistics and correlations using data analysis tool)
NOTE: I CANNOT ATTACH SPREADSHEET AS IT IS 1892 ROWS LONG
Please explain to me HOW I would set up the pivot table in order to make the combination chart/check boxes.
I attached a screenshot of the first few lines of the excel doc for context.
Expert Answer:
From the Midsegment theorem It states that the segment Connecting The midpoints of two ... View the full answer


Data Analysis and Decision Making
ISBN: 978-0538476126
4th edition
Authors: Christian Albright, Wayne Winston, Christopher Zappe
