

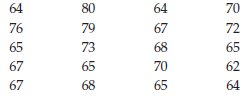
Which type of figure should be used to represent the data in Exercise 1a bar graph, histogram,
Question:
Fantastic news! We've Found the answer you've been seeking!
Step by Step Answer:
Either a histogram or a frequency polygon could ...View the full answer

Answered By
GERALD KAMAU
non-plagiarism work, timely work and A++ work
6+ Reviews
11+ Question Solved
Related Book For 

Research Methods And Statistics A Critical Thinking Approach
ISBN: 9781305257795
5th Edition
Authors: Sherri L. Jackson
Question Posted:
