

Refer to the Baseball 2018 data, which report information on the 30 Major League Baseball teams for
Question:
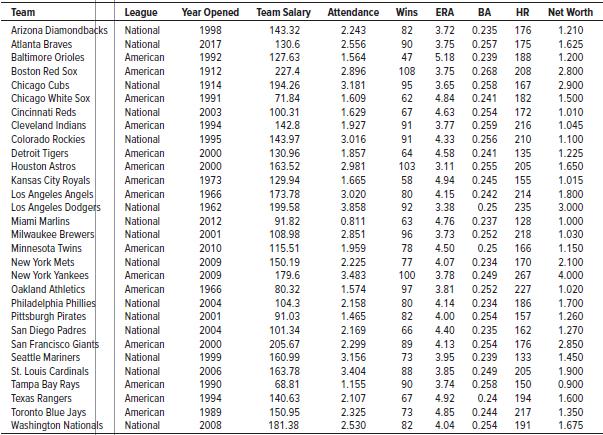
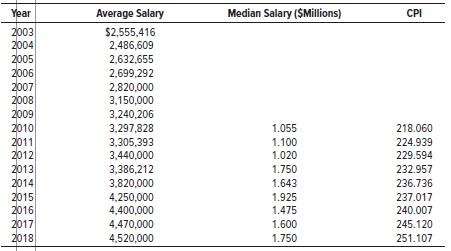
Refer to the Baseball 2018 data, which report information on the 30 Major League Baseball teams for the 2018 season.
a. At the .10 significance level, is there a difference in the variation in team salary among the American and National League teams?
b. Create a variable that classifies a team’s total attendance into three groups: less than 2.0 (million), 2.0 up to 3.0, and 3.0 or more. At the .05 significance level, is there a difference in the mean number of games won among the three groups?
c. Using the same attendance variable developed in part (b), is there a difference in the mean number of home runs hit per team? Use the .05 significance level.
d. Using the same attendance variable developed in part (b), is there a difference in the mean salary of the three groups? Use the .05 significance level.
Data From Baseball 2018:
Step by Step Answer:
a The twotailed pvalue is 222 44 Do not reject H o There may be no difference in the variances of te...View the full answer


Statistical Techniques In Business And Economics
ISBN: 9781260239478
18th Edition
Authors: Douglas Lind, William Marchal, Samuel Wathen
