

Figure 30 represents the educational attainment (level of education) in 2013 of adults 25 years and older
Question:
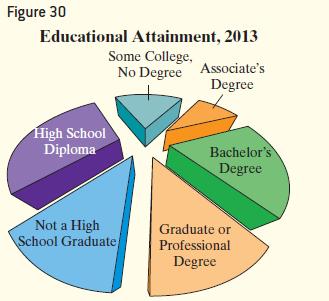
Figure 30 represents the educational attainment (level of education) in 2013 of adults 25 years and older who are U.S. residents. Why might this graph be considered misrepresentative.
Approach Find any characteristics that may mislead a reader, such as overemphasis on one category of data.
Fantastic news! We've Found the answer you've been seeking!
Step by Step Answer:
Threedimensional pie charts tend to overstate the significance of categories clo...View the full answer

Answered By
Utsab mitra
I have the expertise to deliver these subjects to college and higher-level students. The services would involve only solving assignments, homework help, and others.
I have experience in delivering these subjects for the last 6 years on a freelancing basis in different companies around the globe. I am CMA certified and CGMA UK. I have professional experience of 18 years in the industry involved in the manufacturing company and IT implementation experience of over 12 years.
I have delivered this help to students effortlessly, which is essential to give the students a good grade in their studies.
2+ Reviews
10+ Question Solved
Related Book For 

Statistics Informed Decisions Using Data
ISBN: 9781292157115
5th Global Edition
Authors: Michael Sullivan
Question Posted:
