

The data in Table 4 represent the educational attainment in 1990 and 2013 of adults 25 years
Question:
The data in Table 4 represent the educational attainment in 1990 and 2013 of adults 25 years and older who are residents of the United States. The data are in thousands. So 39,344 represents 39,344,000.
(a) Draw a side-by-side relative frequency bar graph of the data.
(b) Make some general conclusions based on the graph.
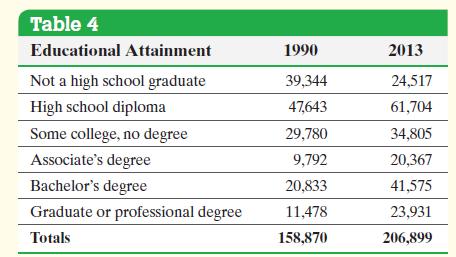
Approach First, determine the relative frequencies of each category for each year. To construct side-by-side bar graphs, draw two bars for each category of data, one for 1990, the other for 2013.
Fantastic news! We've Found the answer you've been seeking!
Step by Step Answer:
Table 5 shows the relative frequency for each categ...View the full answer

Answered By
Anurag Agrawal
I am a highly enthusiastic person who likes to explain concepts in simplified language. Be it in my job role as a manager of 4 people or when I used to take classes for specially able kids at our university. I did this continuously for 3 years and my god, that was so fulfilling. Sometimes I've skipped my own classes just to teach these kids and help them get their fair share of opportunities, which they would have missed out on. This was the key driver for me during that time. But since I've joined my job I wasn't able to make time for my passion of teaching due to hectic schedules. But now I've made a commitment to teach for at least an hour a day.
I am highly proficient in school level math and science and reasonably good for college level. In addition to this I am especially interested in courses related to finance and economics. In quest to learn I recently gave the CFA level 1 in Dec 19, hopefully I'll clear it. Finger's crossed :)
2+ Reviews
10+ Question Solved
Related Book For 

Statistics Informed Decisions Using Data
ISBN: 9781292157115
5th Global Edition
Authors: Michael Sullivan
Question Posted:
