

The bar graph illustrated in Figure 27 is a USA Today-type graph. A survey was conducted by
Question:
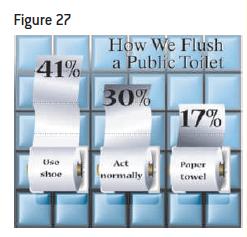
The bar graph illustrated in Figure 27 is a USA Today-type graph. A survey was conducted by Impulse Research for Quilted Northern Confidential in which individuals were asked how they would flush a toilet when the facilities are not sanitary.
What’s wrong with the graphic?
Approach Compare the vertical scales of each bar to see if they accurately depict the given percentages.
Fantastic news! We've Found the answer you've been seeking!
Step by Step Answer:
First it is unclear whether the bars include the rol...View the full answer

Answered By
Muhammad Rehan
Enjoy testing and can find bugs easily and help improve the product quality.
10+ Reviews
10+ Question Solved
Related Book For 

Statistics Informed Decisions Using Data
ISBN: 9781292157115
5th Global Edition
Authors: Michael Sullivan
Question Posted:
