

The following time-series plot shows the annual unemployment and inflation rates for the years 1988 through 2009.
Question:
The following time-series plot shows the annual unemployment and inflation rates for the years 1988 through 2009.
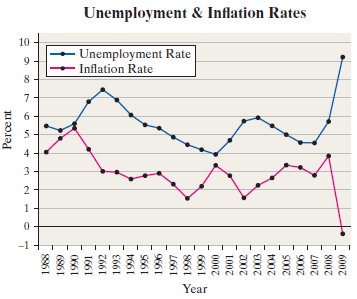
(a) Estimate the unemployment and inflation rates for 1992.
(b) Estimate the unemployment and inflation rates for 2009.
(c) The misery index is defined as the sum of the unemployment rate and the inflation rate. Use your results from (a) and (b) to estimate the misery index for the years 1992 and 2009.
(d) Describe any relationship that might exist between the unemployment rate and inflation rate over the time period shown.
Fantastic news! We've Found the answer you've been seeking!
Step by Step Answer:
a For 1992 the unemployment rate was about 75 and the inflation rate was about 30 b For 2009 t...View the full answer

Answered By
CHARLES AMBILA
I am an experienced tutor with more than 7 years of experience. I have helped thousands of students pursue their academic goals. My primary objective as a tutor is to ensure that students have easy time handling their academic tasks.
109+ Reviews
323+ Question Solved
Related Book For 

Statistics Informed Decisions Using Data
ISBN: 9780321757272
4th Edition
Authors: Michael Sullivan III
Question Posted:
