

Cover up the schedule you constructed as your answer to 44.1 (i) and look instead at the
Question:
Cover up the schedule you constructed as your answer to 44.1
(i) and look instead at the break-even chart constructed as the answer to 44.1
(ii). Answer the following:
(a) What are the total costs at production levels of
(i) 4,000 units;
(ii) 7,000 units;
(iii) 9,000 units;
(iv) 5,500 units?
(b) What is the total revenue at
(i) 3,000 units;
(ii) 8,000 units;
(iii) 5,500 units?
Data from Question 44.1
Hedges Ltd has fixed costs of £8,000. The variable costs are £4 per unit. The revenue (selling price) is £6 per unit. You are required (i) to draft a schedule as follows filling in the columns (a) to (f) for each stage of 1,000 units up to 10,000 units.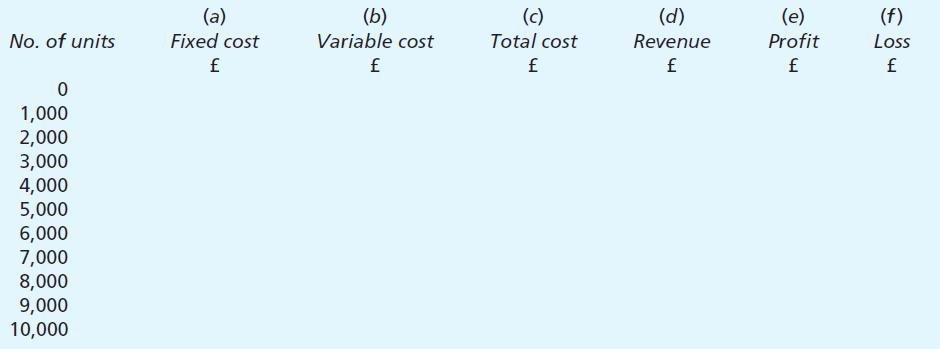
(ii) You are also required to draw a break-even chart from the data in this schedule. Draw it carefully to scale on a piece of graph paper. Retain your answer, you will need it for some questions which follow later.
Step by Step Answer:
First lets calculate the total costs for each production lev...View the full answer


Frank Woods Business Accounting Volume 2
ISBN: 9780273693109
10th Edition
Authors: Frank Wood, Alan Sangster
