

A plot such as the example sketch of Fig. D4.8 shows the range of values of two
Question:
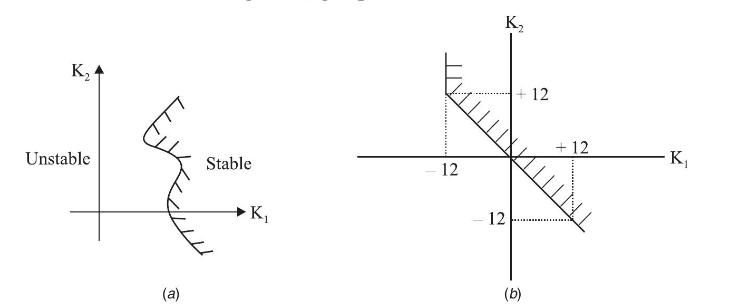
A plot such as the example sketch of Fig. D4.8 shows the range of values of two parameters \(K_{1}\) and \(K_{2}\) for which a system is stable. It is called a stability boundary diagram. Draw such a diagram for a system with characteristic equation.
\[
s^{2}+\left(6+0.5 \mathrm{~K}_{1}ight) s+3\left(\mathrm{~K}_{1}+\mathrm{K}_{2}ight)=0
\]
Step by Step Answer:

This question has not been answered yet.
You can Ask your question!
Related Book For 

Question Posted:
