Figure P5.53 shows the block diagram of a possible cascade control scheme for an HEV driven by
Question:
Figure P5.53 shows the block diagram of a possible cascade control scheme for an HEV driven by a dc motor (Preitl, 2007).
Let the speed controller GSC(s) = 100 + 40/s, the torque controller and power amp KAGTC(s) = 10 + 6/s, the current sensor sensitivity KCS = 0.5, the speed sensor sensitivity KSS =0.0433. Also, following the development in previous chapters 1/Ra = 1; ηtotKt = 1.8; kb = 2; D = kf = 0.1; 1/Jtot = 1/7.226; r/itot = 0.0615; and ρCwAv0 r/itot = 0.6154.
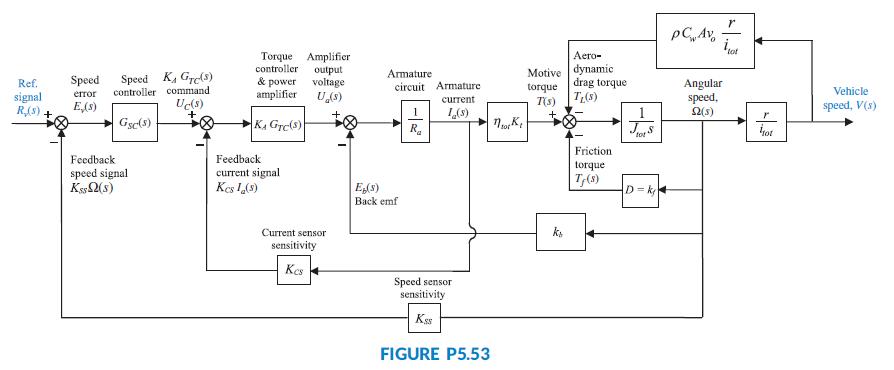
a. Substitute these values in the block diagram, and find the transfer function, T(s) =V(s)/Rv(s), using blockdiagram reduction rules. [Hint: Start by moving the last r/ itot block to the right past the pickoff point.]
b. Develop a Simulink model for the original system in Figure P5.53. Set the reference signal input, rv(t) = 4 u(t), as a step input with a zero initial value, a step time = 0 seconds, and a final value of 4 volts. Use X-Y graphs to display (over the period from 0 to 8 seconds) the response of the following variables to the step input: (1) change in car speed (m/s), (2) car acceleration (m/s2), and (3) motor armature current (A).
To record the time and the above three variables (in array format), connect them to four Workspace sinks, each of which carries the respective variable name. After the simulation ends, utilize MATLAB plot commands to obtain and edit the three graphs of interest.
Step by Step Answer:
The overall transfer function is GL5s is shown in the obtained result in command window Ans A Matlab ...View the full answer