

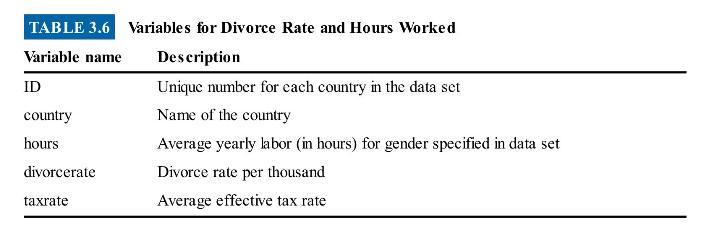
Table 3.6 lists the variables in the WorkWomen.dta and WorkMen.dta data sets, which are based on Chakraborty,
Question:
Table 3.6 lists the variables in the WorkWomen.dta and WorkMen.dta data sets, which are based on Chakraborty, Holter, and Stepanchuk (2012). Answer the following questions about the relationship between hours worked and divorce rates:
(a) For each data set (for women and for men), create a scatterplot of hours worked on the \(\mathrm{Y}\)-axis and divorce rates on the \(\mathrm{X}\)-axis.
(b) For each data set, estimate an OLS regression in which hours worked is regressed on divorce rates. Report the estimated regression equation, and interpret the coefficients. Explain any differences in coefficients.
(c) What are the fitted value and residual for men in Germany?
(d) What are the fitted value and residual for women in Spain?
Step by Step Answer:


Real Econometrics The Right Tools To Answer Important Questions
ISBN: 9780190857462
2nd Edition
Authors: Michael Bailey
