

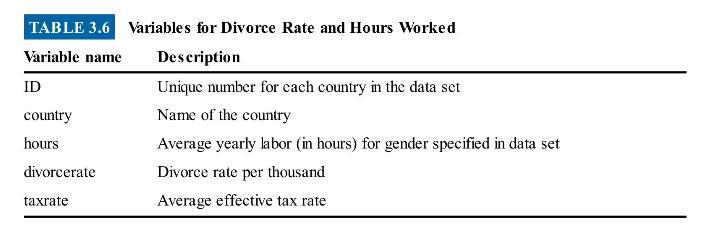
Use the data described in Table 3.6 to answer the following questions about the relationship between hours
Question:
Use the data described in Table 3.6 to answer the following questions about the relationship between hours worked and tax rates:
(a) For each data set (for women and for men), create a scatterplot of hours worked on the \(\mathrm{Y}\)-axis and tax rates on the \(\mathrm{X}\)-axis.
(b) For each data, set estimate an OLS regression in which hours worked is regressed on tax rates. Report the estimated regression equation, and interpret the coefficients. Explain any differences in coefficients.
(c) What are the fitted value and residual for men in the United States?
(d) What are the fitted value and residual for women in Italy?
Fantastic news! We've Found the answer you've been seeking!
Step by Step Answer:

Answered By
Joemar Canciller
I teach mathematics to students because I love to share what I have in this field.
I also want to see the students to love math and be fearless in this field.
I've been tutoring these past 2 years and I would like to continue what I've been doing.
1+ Reviews
10+ Question Solved
Related Book For 
Real Econometrics The Right Tools To Answer Important Questions
ISBN: 9780190857462
2nd Edition
Authors: Michael Bailey
Question Posted:
