

Question
2. Economic fluctuations and growth The following table shows data on a hypothetical country's real GDP from 1980 through 1988: Year 1980 1981 1982
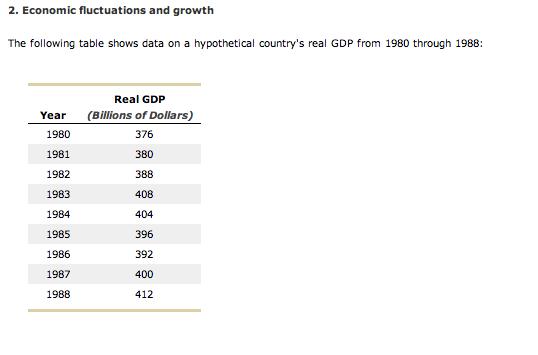
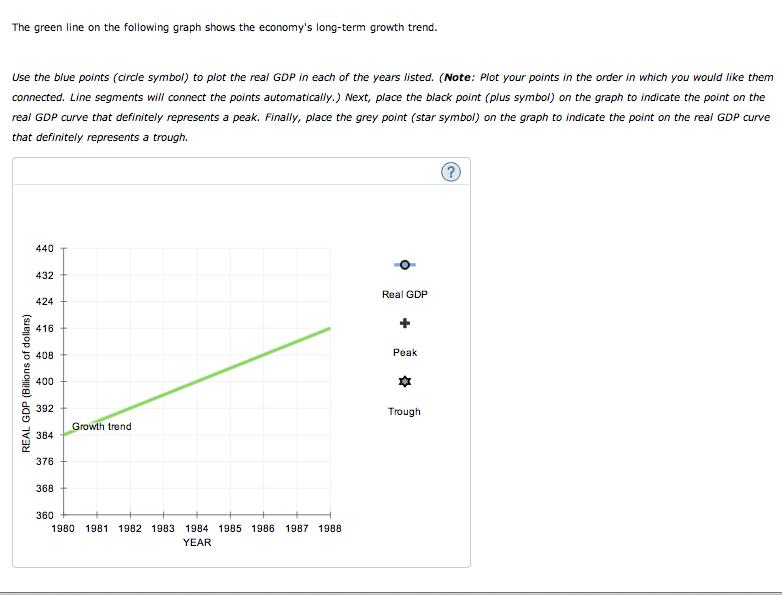
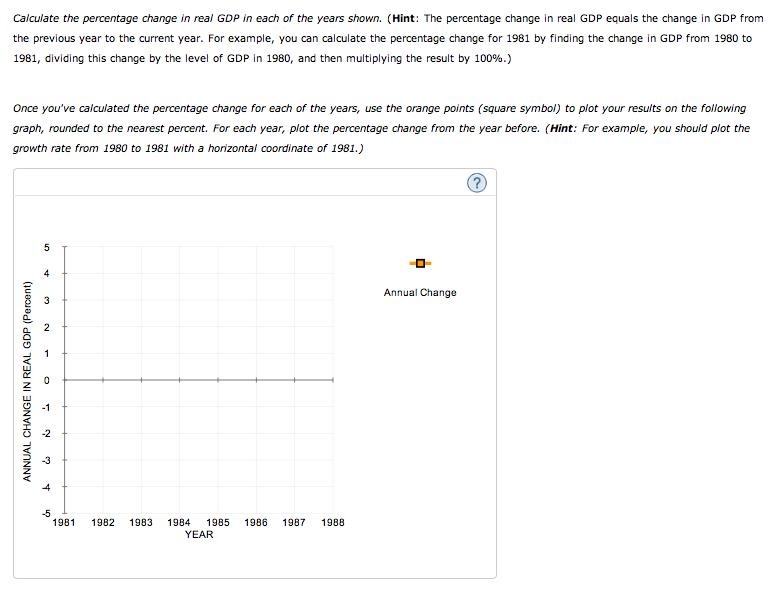
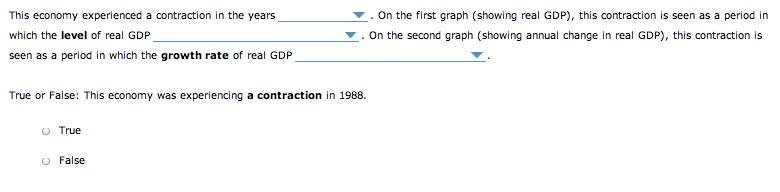
2. Economic fluctuations and growth The following table shows data on a hypothetical country's real GDP from 1980 through 1988: Year 1980 1981 1982 1983 1984 1985 1986. 1987 1988 Real GDP (Billions of Dollars) 376 380 388 408 404 396 392 400 412 The green line on the following graph shows the economy's long-term growth trend. Use the blue points (circle symbol) to plot the real GDP in each of the years listed. (Note: Plot your points in the order in which you would like them connected. Line segments will connect the points automatically.) Next, place the black point (plus symbol) on the graph to indicate the point on the real GDP curve that definitely represents a peak. Finally, place the grey point (star symbol) on the graph to indicate the point on the real GDP curve that definitely represents a trough. REAL GDP (Billions of dollars) 440 432 424 416 408 400 392 384 376 368 360 Growth trend 1980 1981 1982 1983 1984 1985 1986 1987 1988 YEAR Real GDP + Peak Trough Calculate the percentage change in real GDP in each of the years shown. (Hint: The percentage change in real GDP equals the change in GDP from the previous year to the current year. For example, you can calculate the percentage change for 1981 by finding the change in GDP from 1980 to 1981, dividing this change by the level of GDP in 1980, and then multiplying the result by 100%.) Once you've calculated the percentage change for each of the years, use the orange points (square symbol) to plot your results on the following graph, rounded to the nearest percent. For each year, plot the percentage change from the year before. (Hint: For example, you should plot the growth rate from 1980 to 1981 with a horizontal coordinate of 1981.) ANNUAL CHANGE IN REAL GDP (Percent) 5 4 3 O 5 N 3 4 -5 1981 1982 1983 1984 1985 1986 1987 1988 YEAR Annual Change This economy experienced a contraction in the years which the level of real GDP seen as a period in which the growth rate of real GDP True or False: This economy was experiencing a contraction in 1988. True False On the first graph (showing real GDP), this contraction is seen as a period in On the second graph (showing annual change in real GDP), this contraction is
Step by Step Solution
3.38 Rating (117 Votes )
There are 3 Steps involved in it
Step: 1
Given Real GDP of various years The below graph sho...
Get Instant Access with AI-Powered Solutions
See step-by-step solutions with expert insights and AI powered tools for academic success
Step: 2

Step: 3
Ace Your Homework with AI
Get the answers you need in no time with our AI-driven, step-by-step assistance
Get Started
Macroeconomics
Authors: Paul Krugman, Robin Wells, Iris Au, Jack Parkinson
3rd Canadian edition
1319120083, 1319120085, 1319190111, 9781319190118, 978-1319120054