

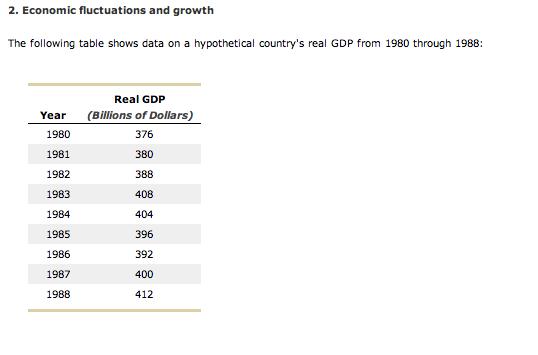
2. Economic fluctuations and growth The following table shows data on a hypothetical country's real GDP...
Fantastic news! We've Found the answer you've been seeking!
Question:
Expert Answer:

Related Book For 

Macroeconomics
ISBN: 978-1319120054
3rd Canadian edition
Authors: Paul Krugman, Robin Wells, Iris Au, Jack Parkinson
Posted Date:
