

In December of the prior year, sales were forecasted as follows: January, 96 units; February, 91...
Fantastic news! We've Found the answer you've been seeking!
Question:
Transcribed Image Text:
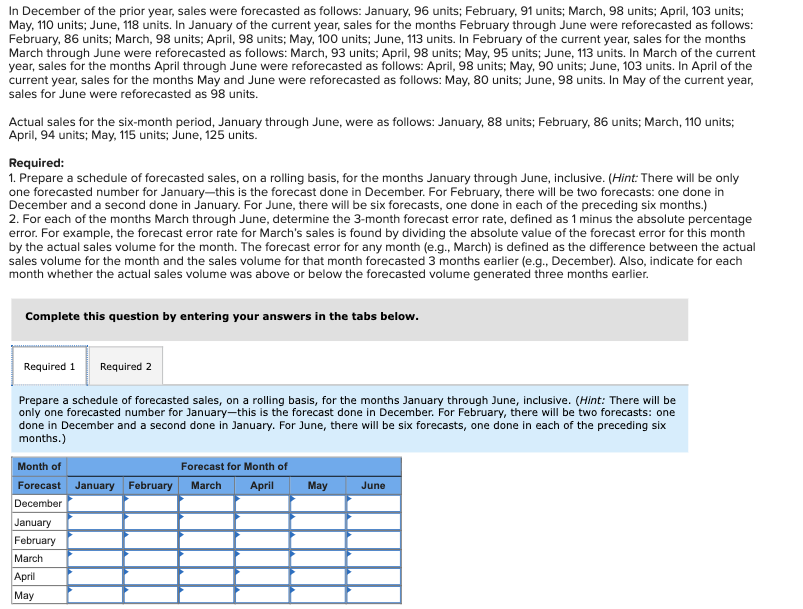
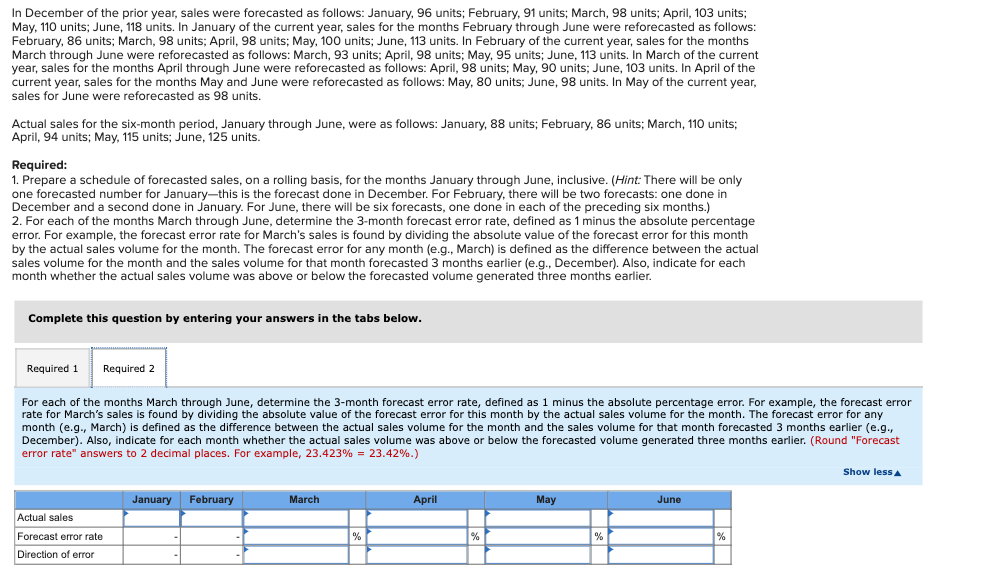
In December of the prior year, sales were forecasted as follows: January, 96 units; February, 91 units; March, 98 units; April, 103 units; May, 110 units; June, 118 units. In January of the current year, sales for the months February through June were reforecasted as follows: February, 86 units; March, 98 units; April, 98 units; May, 100 units; June, 113 units. In February of the current year, sales for the months March through June were reforecasted as follows: March, 93 units; April, 98 units; May, 95 units; June, 113 units. In March of the current year, sales for the months April through June were reforecasted as follows: April, 98 units; May, 90 units; June, 103 units. In April of the current year, sales for the months May and June were reforecasted as follows: May, 80 units; June, 98 units. In May of the current year, sales for June were reforecasted as 98 units. Actual sales for the six-month period, January through June, were as follows: January, 88 units; February, 86 units; March, 110 units; April, 94 units; May, 115 units; June, 125 units. Required: 1. Prepare a schedule of forecasted sales, on a rolling basis, for the months January through June, inclusive. (Hint: There will be only one forecasted number for January-this is the forecast done in December. For February, there will be two forecasts: one done in December and a second done in January. For June, there will be six forecasts, one done in each of the preceding six months.) 2. For each of the months March through June, determine the 3-month forecast error rate, defined as 1 minus the absolute percentage error. For example, the forecast error rate for March's sales is found by dividing the absolute value of the forecast error for this month by the actual sales volume for the month. The forecast error for any month (e.g., March) is defined as the difference between the actual sales volume for the month and the sales volume for that month forecasted 3 months earlier (e.g., December). Also, indicate for each month whether the actual sales volume was above or below the forecasted volume generated three months earlier. Complete this question by entering your answers in the tabs below. Required 1 Required 2 Prepare a schedule of forecasted sales, on a rolling basis, for the months January through June, inclusive. (Hint: There will be only one forecasted number for January-this is the forecast done in December. For February, there will be two forecasts: one done in December and a second done in January. For June, there will be six forecasts, one done in each of the preceding six months.) Month of Forecast for Month of April May June Forecast January February March December January February March April May In December of the prior year, sales were forecasted as follows: January, 96 units; February, 91 units; March, 98 units; April, 103 units; May, 110 units; June, 118 units. In January of the current year, sales for the months February through June were reforecasted as follows: February, 86 units; March, 98 units; April, 98 units; May, 100 units; June, 113 units. In February of the current year, sales for the months March through June were reforecasted as follows: March, 93 units; April, 98 units; May, 95 units; June, 113 units. In March of the current year, sales for the months April through June were reforecasted as follows: April, 98 units; May, 90 units; June, 103 units. In April of the current year, sales for the months May and June were reforecasted as follows: May, 80 units; June, 98 units. In May of the current year, sales for June were reforecasted as 98 units. Actual sales for the six-month period, January through June, were as follows: January, 88 units; February, 86 units; March, 110 units; April, 94 units; May, 115 units; June, 125 units. Required: 1. Prepare a schedule of forecasted sales, on a rolling basis, for the months January through June, inclusive. (Hint: There will be only one forecasted number for January-this is the forecast done in December. For February, there will be two forecasts: one done in December and a second done in January. For June, there will be six forecasts, one done in each of the preceding six months.) 2. For each of the months March through June, determine the 3-month forecast error rate, defined as 1 minus the absolute percentage error. For example, the forecast error rate for March's sales is found by dividing the absolute value of the forecast error for this month by the actual sales volume for the month. The forecast error for any month (e.g., March) is defined as the difference between the actual sales volume for the month and the sales volume for that month forecasted 3 months earlier (e.g., December). Also, indicate for each month whether the actual sales volume was above or below the forecasted volume generated three months earlier. Complete this question by entering your answers in the tabs below. Required 1 Required 2 For each of the months March through June, determine the 3-month forecast error rate, defined as 1 minus the absolute percentage error. For example, the forecast error rate for March's sales is found by dividing the absolute value of the forecast error for this month by the actual sales volume for the month. The forecast error for any month (e.g., March) is defined as the difference between the actual sales volume for the month and the sales volume for that month forecasted 3 months earlier (e.g., December). Also, indicate for each month whether the actual sales volume was above or below the forecasted volume generated three months earlier. (Round "Forecast error rate" answers to 2 decimal places. For example, 23.423% = 23.42%.) Actual sales Forecast error rate Direction of error January February March April % % May % June % Show less In December of the prior year, sales were forecasted as follows: January, 96 units; February, 91 units; March, 98 units; April, 103 units; May, 110 units; June, 118 units. In January of the current year, sales for the months February through June were reforecasted as follows: February, 86 units; March, 98 units; April, 98 units; May, 100 units; June, 113 units. In February of the current year, sales for the months March through June were reforecasted as follows: March, 93 units; April, 98 units; May, 95 units; June, 113 units. In March of the current year, sales for the months April through June were reforecasted as follows: April, 98 units; May, 90 units; June, 103 units. In April of the current year, sales for the months May and June were reforecasted as follows: May, 80 units; June, 98 units. In May of the current year, sales for June were reforecasted as 98 units. Actual sales for the six-month period, January through June, were as follows: January, 88 units; February, 86 units; March, 110 units; April, 94 units; May, 115 units; June, 125 units. Required: 1. Prepare a schedule of forecasted sales, on a rolling basis, for the months January through June, inclusive. (Hint: There will be only one forecasted number for January-this is the forecast done in December. For February, there will be two forecasts: one done in December and a second done in January. For June, there will be six forecasts, one done in each of the preceding six months.) 2. For each of the months March through June, determine the 3-month forecast error rate, defined as 1 minus the absolute percentage error. For example, the forecast error rate for March's sales is found by dividing the absolute value of the forecast error for this month by the actual sales volume for the month. The forecast error for any month (e.g., March) is defined as the difference between the actual sales volume for the month and the sales volume for that month forecasted 3 months earlier (e.g., December). Also, indicate for each month whether the actual sales volume was above or below the forecasted volume generated three months earlier. Complete this question by entering your answers in the tabs below. Required 1 Required 2 Prepare a schedule of forecasted sales, on a rolling basis, for the months January through June, inclusive. (Hint: There will be only one forecasted number for January-this is the forecast done in December. For February, there will be two forecasts: one done in December and a second done in January. For June, there will be six forecasts, one done in each of the preceding six months.) Month of Forecast for Month of April May June Forecast January February March December January February March April May In December of the prior year, sales were forecasted as follows: January, 96 units; February, 91 units; March, 98 units; April, 103 units; May, 110 units; June, 118 units. In January of the current year, sales for the months February through June were reforecasted as follows: February, 86 units; March, 98 units; April, 98 units; May, 100 units; June, 113 units. In February of the current year, sales for the months March through June were reforecasted as follows: March, 93 units; April, 98 units; May, 95 units; June, 113 units. In March of the current year, sales for the months April through June were reforecasted as follows: April, 98 units; May, 90 units; June, 103 units. In April of the current year, sales for the months May and June were reforecasted as follows: May, 80 units; June, 98 units. In May of the current year, sales for June were reforecasted as 98 units. Actual sales for the six-month period, January through June, were as follows: January, 88 units; February, 86 units; March, 110 units; April, 94 units; May, 115 units; June, 125 units. Required: 1. Prepare a schedule of forecasted sales, on a rolling basis, for the months January through June, inclusive. (Hint: There will be only one forecasted number for January-this is the forecast done in December. For February, there will be two forecasts: one done in December and a second done in January. For June, there will be six forecasts, one done in each of the preceding six months.) 2. For each of the months March through June, determine the 3-month forecast error rate, defined as 1 minus the absolute percentage error. For example, the forecast error rate for March's sales is found by dividing the absolute value of the forecast error for this month by the actual sales volume for the month. The forecast error for any month (e.g., March) is defined as the difference between the actual sales volume for the month and the sales volume for that month forecasted 3 months earlier (e.g., December). Also, indicate for each month whether the actual sales volume was above or below the forecasted volume generated three months earlier. Complete this question by entering your answers in the tabs below. Required 1 Required 2 For each of the months March through June, determine the 3-month forecast error rate, defined as 1 minus the absolute percentage error. For example, the forecast error rate for March's sales is found by dividing the absolute value of the forecast error for this month by the actual sales volume for the month. The forecast error for any month (e.g., March) is defined as the difference between the actual sales volume for the month and the sales volume for that month forecasted 3 months earlier (e.g., December). Also, indicate for each month whether the actual sales volume was above or below the forecasted volume generated three months earlier. (Round "Forecast error rate" answers to 2 decimal places. For example, 23.423% = 23.42%.) Actual sales Forecast error rate Direction of error January February March April % % May % June % Show less
Expert Answer:

Related Book For 

Cost management a strategic approach
ISBN: 978-0073526942
5th edition
Authors: Edward J. Blocher, David E. Stout, Gary Cokins
Posted Date:
Students also viewed these accounting questions
-
Compare Figure 3.21 with Figure 3.23, and explain the difference between the geodatabase and the coverage in handling the route data structure. Route ID 1 1 1 07 Section- ID 1 2 1 3 Figure 3.21 The...
-
Reading material Raymond Frost, Alexa K. Fox & Judy Strauss (2019). Product: The Online Offer. E-Marketing , 9, 206 - 228. Raymond Frost, Alexa K. Fox & Judy Strauss (2019). Price: The Online Value....
-
Which of these are the first and last elements in a spinal reflex? a. axon and dendrite b. sensory receptor and muscle effector c. ventral horn and dorsal horn d. brain and skeletal muscle e. motor...
-
1. What are the underlying ethical issues in this situation? 2. From an ethical standpoint, what is an appropriate response to the customer's question? What steps should you take in responding to it?...
-
Assume HPC, Inc., began December with 60 units of inventory that cost a total of $720. During December, HPC, Inc., purchased and sold goods as follows: HPC, Inc., uses perpetual inventory. Under the...
-
Juarez, Inc. uses a job-order costing system for its products, which pass from the Machining Department, to the Assembly Department, to finished-goods inventory. The Machining Department is heavily...
-
Consider the two securities, X and Y. The expected returns and standard deviations for the two securities are shown in Table 1 below. Table 1: Expected return and standard deviation of return for X...
-
Below is review of the books and records at December 31 for East West College. The review has identified the matters that may need addressing. Record any adjustments required to complete the year end...
-
In the case of Mohammed Abdi, who is 8 2 years old? Explain
-
Design a lowpass filter using one decimation/interpolation stage satisfying the following specifications: \[\begin{aligned}& \delta_{\mathrm{p}}=0.001 \\& \delta_{\mathrm{r}} \leq 0.0001 \\&...
-
Look at the following pseudocode class definitions: Given these class definitions, what will the following pseudocode display? Class Plant Public Module message () Display "I'm a plant. End Module...
-
Design a program that displays the number of days in each month. The programs output should be similar to this: The program should have two parallel arrays: a 12-element String array that is...
-
Use Oracles Java API documentation to help you describe each of the following StandardOpenOption constants: APPEND, CREATE, READ, TRUNCATE_EXISTING, and WRITE. public static BufferedWriter new...
-
Design the following filters using the Kaiser window: (a) \(A_{\mathrm{p}}=1.0 \mathrm{~dB}\) \(A_{\mathrm{r}}=40 \mathrm{~dB}\) \(\Omega_{\mathrm{p}}=1000 \mathrm{rad} / \mathrm{s}\)...
-
Select a system of your choice and identify a particular element or component of that system. Assume that the component selected has failed. Develop a Maintenance Task Analysis (MTA)covering the...
-
Synthesize the products by drawing out reagents and intermediates along the way. `N H. OH HO HO
-
Why does management need to separate direct labor variances into rate and efficiency components?
-
Assume the following for Black Top, Inc., for 2010. Black Top applies overhead on the basis of units produced. Budgeted overhead ........... $210,000 Actual overhead ........... $222,000 Actual...
-
Waymouth Manufacturing operates a contract manufacturing plant located in Dublin, Ireland. The plant provides a variety of electronics products and components to consumer goods manufacturers around...
-
Derive the equation of motion for the system in Figure 5.21 for generalized coordinate \(x_{2}\) using (a) Lagrange's equation, and (b) Hamilton's principle. k M, R. IG. x1 m X2 Figure 5.21:...
-
Derive the equation of motion for the system in Figure 5.25 for generalized coordinate \(\theta\) using (a) Lagrange's equation, and (b) Hamilton's principle. K 6000 Figure 5.25: Restrained rigid...
-
Derive the equation of motion for the system in Figure 5.26 for generalized coordinate \(x\) using (a) Lagrange's equation, and (b) Hamilton's principle. eeeee IG 8 Position of the disk when the...

Study smarter with the SolutionInn App