

The following figure shows the speed control of an assembly plant. Determine and plot the range of
Question:
The following figure shows the speed control of an assembly plant.
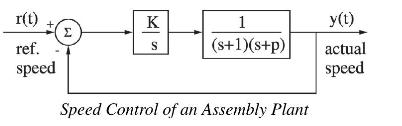 Determine and plot the range of \(K\) and \(p\) that permits stable operation.
Fantastic news! We've Found the answer you've been seeking!
Step by Step Answer:
The transfer function for the system is given by TsfracKs3p1 s2p sK The ...View the full answer

Answered By
Wahome Michael
I am a CPA finalist and a graduate in Bachelor of commerce. I am a full time writer with 4 years experience in academic writing (essays, Thesis, dissertation and research). I am also a full time writer which assures you of my quality, deep knowledge of your task requirement and timeliness. Assign me your task and you shall have the best.
Thanks in advance
63+ Reviews
132+ Question Solved
Related Book For 
Design And Analysis Of Control Systems Driving The Fourth Industrial Revolution
ISBN: 9781032718804
2nd Edition
Authors: Arthur G O Mutambara
Question Posted:
