

A phase diagram is drawn for a mixture of two substances at a fixed pressure p with
Question:
A phase diagram is drawn for a mixture of two substances at a fixed pressure p with one liquid phase and two solid phases (Fig. 6.19). The substances are labelled 1 and 2 and the diagram is shown as a function of the concentration c1 of substance 1. This diagram presents what is called a eutectic point. At the eutectic concentration cE1, the freezing temperature is the lowest. In particular, it is lower than the freezing temperatures of the pure substances (points C and D). At the eutectic, the liquid freezes into a mixture of two solid phases, the α and β phases.
In Figure 6.19
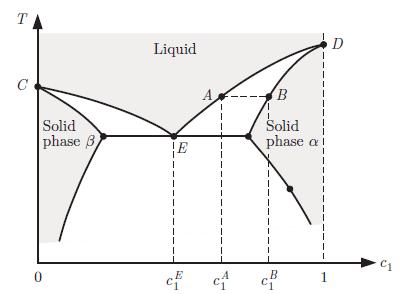 a) Consider a liquid at concentration cA1. As the temperature is lowered, the point A is reached. Describe qualitatively what happens then.b) Describe what happens if a liquid of composition cE1 is cooled.
Step by Step Answer:
ANSWER a When a liquid at concentration cA1 is cooled and reaches point A it starts to freeze into a ...View the full answer


Principles Of Thermodynamics
ISBN: 9781108426091
1st Edition
Authors: Jean-Philippe Ansermet, Sylvain D. Brechet
