

Question: Use the ADDITIVE DECOMPOSITION method to forecast attendance for games 1 - 4 for 2007. 2. Add up the total attendance for each of the
Use the ADDITIVE DECOMPOSITION method to forecast attendance for games 1 - 4 for 2007.
2. Add up the total attendance for each of the 5 years. Using these annual totals, create and find the 2-period MOVING AVERAGE forecast for total 2007 attendance.
3. Using the total attendance for the 5 years, create a 2-period WEIGHTED MOVING AVERAGE forecast for total 2007 attendance (set the weights to 10 for the last period and 5 for the prior period).
4. Using the total attendance for the 5 years, create an EXPONENTIAL SMOOTHING forecast for 2007 attendance (use alpha of .50).
5. Using the total attendance for the 5 years, create a TIME SERIES forecast for 2007 attendance.
6. Compare and contrast each of the 5 models you created, noting the graphs, and the MAD & MSE. Which forecast would you be most likely to accept for 2007 total attendance? Would you believe the forecast from the Additive Decomposition model? Why or why not?
7. Using the actual attendance for 2007 as shown below, how well did each model do?
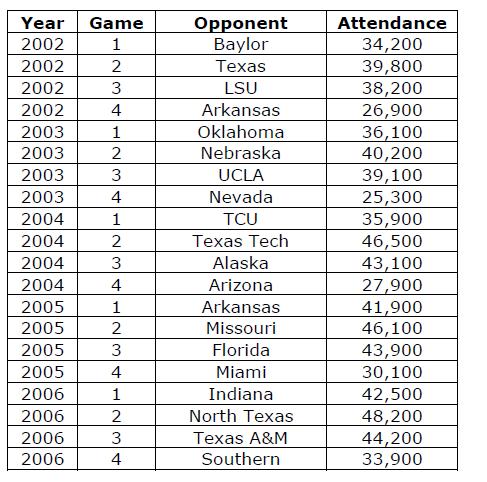
Year Game 2002 1 2002 2002 2002 2003 2003 2003 2003 2004 2004 2004 2004 2005 2005 2005 2005 2006 2006 2006 2006 2 3 4 1 2 3 4 1 2 3 4 1 2 3 4 1 2 3 4 Opponent Baylor Texas LSU Arkansas Oklahoma Nebraska UCLA Nevada TCU Texas Tech Alaska Arizona Arkansas Missouri Florida Miami Indiana North Texas Texas A&M Southern Attendance 34,200 39,800 38,200 26,900 36,100 40,200 39,100 25,300 35,900 46,500 43,100 27,900 41,900 46,100 43,900 30,100 42,500 48,200 44,200 33,900
Step by Step Solution
There are 3 Steps involved in it
Lets continue with the analysis Step 1 Additive Decomposition Method To apply the additive decomposition method we need to decompose the time series i... View full answer

Get step-by-step solutions from verified subject matter experts