

Question: a, b, c, or d Question 6 (1 point) The graph shows the relationship between the scooter's battery energy level and average speed at the
a, b, c, or d
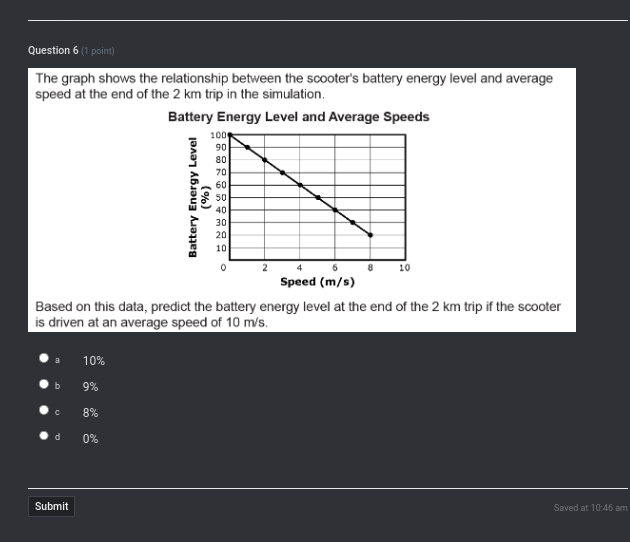 Question 6 (1 point) The graph shows the relationship between the scooter's battery energy level and average speed at the end of the 2 km trip in the simulation. Battery Energy Level and Average Speeds 100 90 Battery Energy Level (%%) 10 Speed (m/s) Based on this data, predict the battery energy level at the end of the 2 km trip if the scooter is driven at an average speed of 10 m/s. 10% 9% 8% d 0% Submit Saved at 10:46 am
Step by Step Solution
There are 3 Steps involved in it
1 Expert Approved Answer
Step: 1 Unlock

Question Has Been Solved by an Expert!
Get step-by-step solutions from verified subject matter experts
Step: 2 Unlock
Step: 3 Unlock