

Question: B1. The table below gives data from a cohort study of women with stage II or stage IIIA ovarian cancer, where the endpoint is
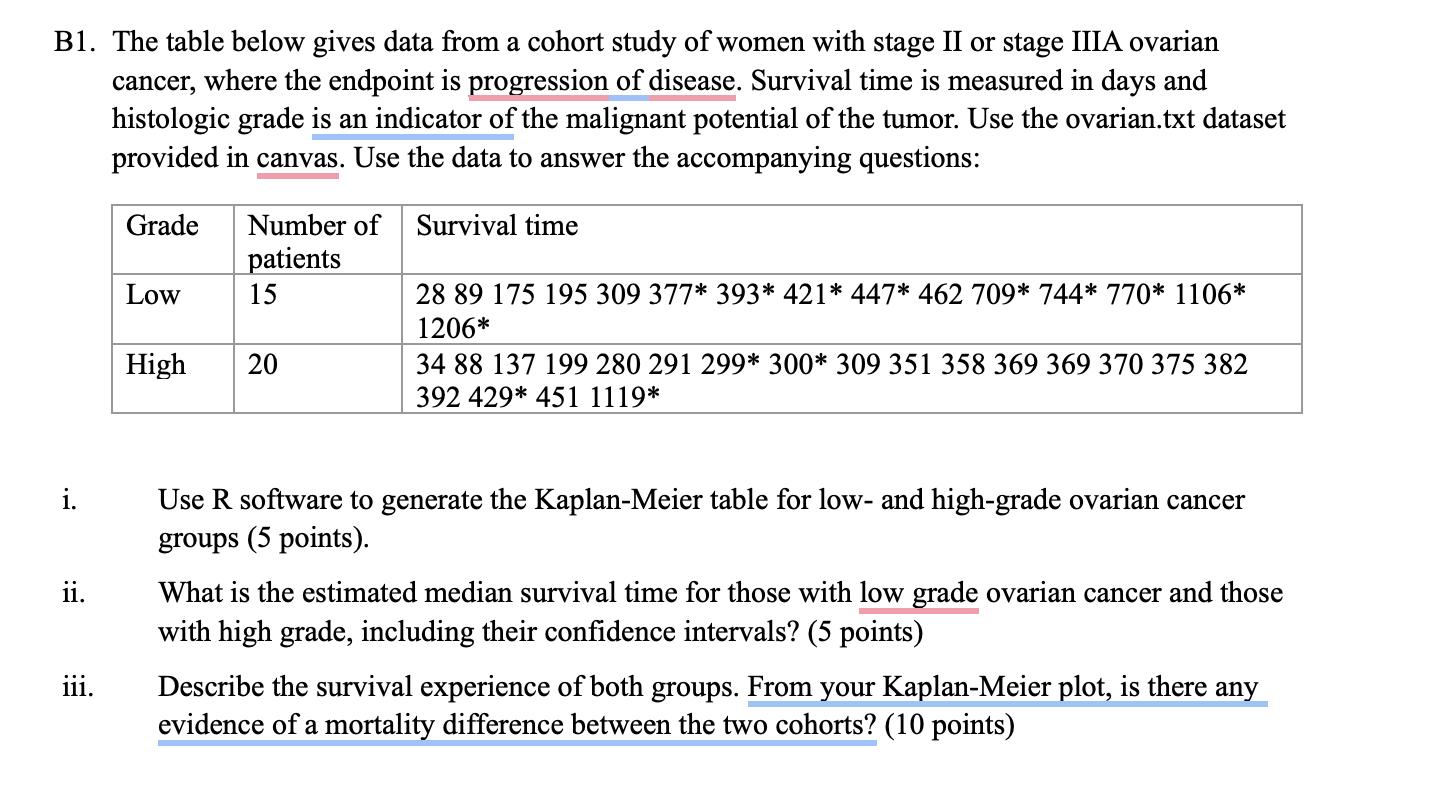
B1. The table below gives data from a cohort study of women with stage II or stage IIIA ovarian cancer, where the endpoint is progression of disease. Survival time is measured in days and histologic grade is an indicator of the malignant potential of the tumor. Use the ovarian.txt dataset provided in canvas. Use the data to answer the accompanying questions: Survival time i. ii. 111. Grade Number of patients 15 Low High 20 28 89 175 195 309 377* 393* 421* 447* 462 709* 744* 770* 1106* 1206* 34 88 137 199 280 291 299* 300* 309 351 358 369 369 370 375 382 392 429* 451 1119* Use R software to generate the Kaplan-Meier table for low- and high-grade ovarian cancer groups (5 points). What is the estimated median survival time for those with low grade ovarian cancer and those with high grade, including their confidence intervals? (5 points) Describe the survival experience of both groups. From your Kaplan-Meier plot, is there any evidence of a mortality difference between the two cohorts? (10 points)
Step by Step Solution
There are 3 Steps involved in it
The question asks us to analyze a dataset containing survival times of women with stage II or stage IIIA ovarian cancer The data is grouped into lowgr... View full answer

Get step-by-step solutions from verified subject matter experts