

Question: complete Activity 1: Graphing The relationship between two or more parameters can be easily visualized by creating a graph. The independent variable is graphed along
complete
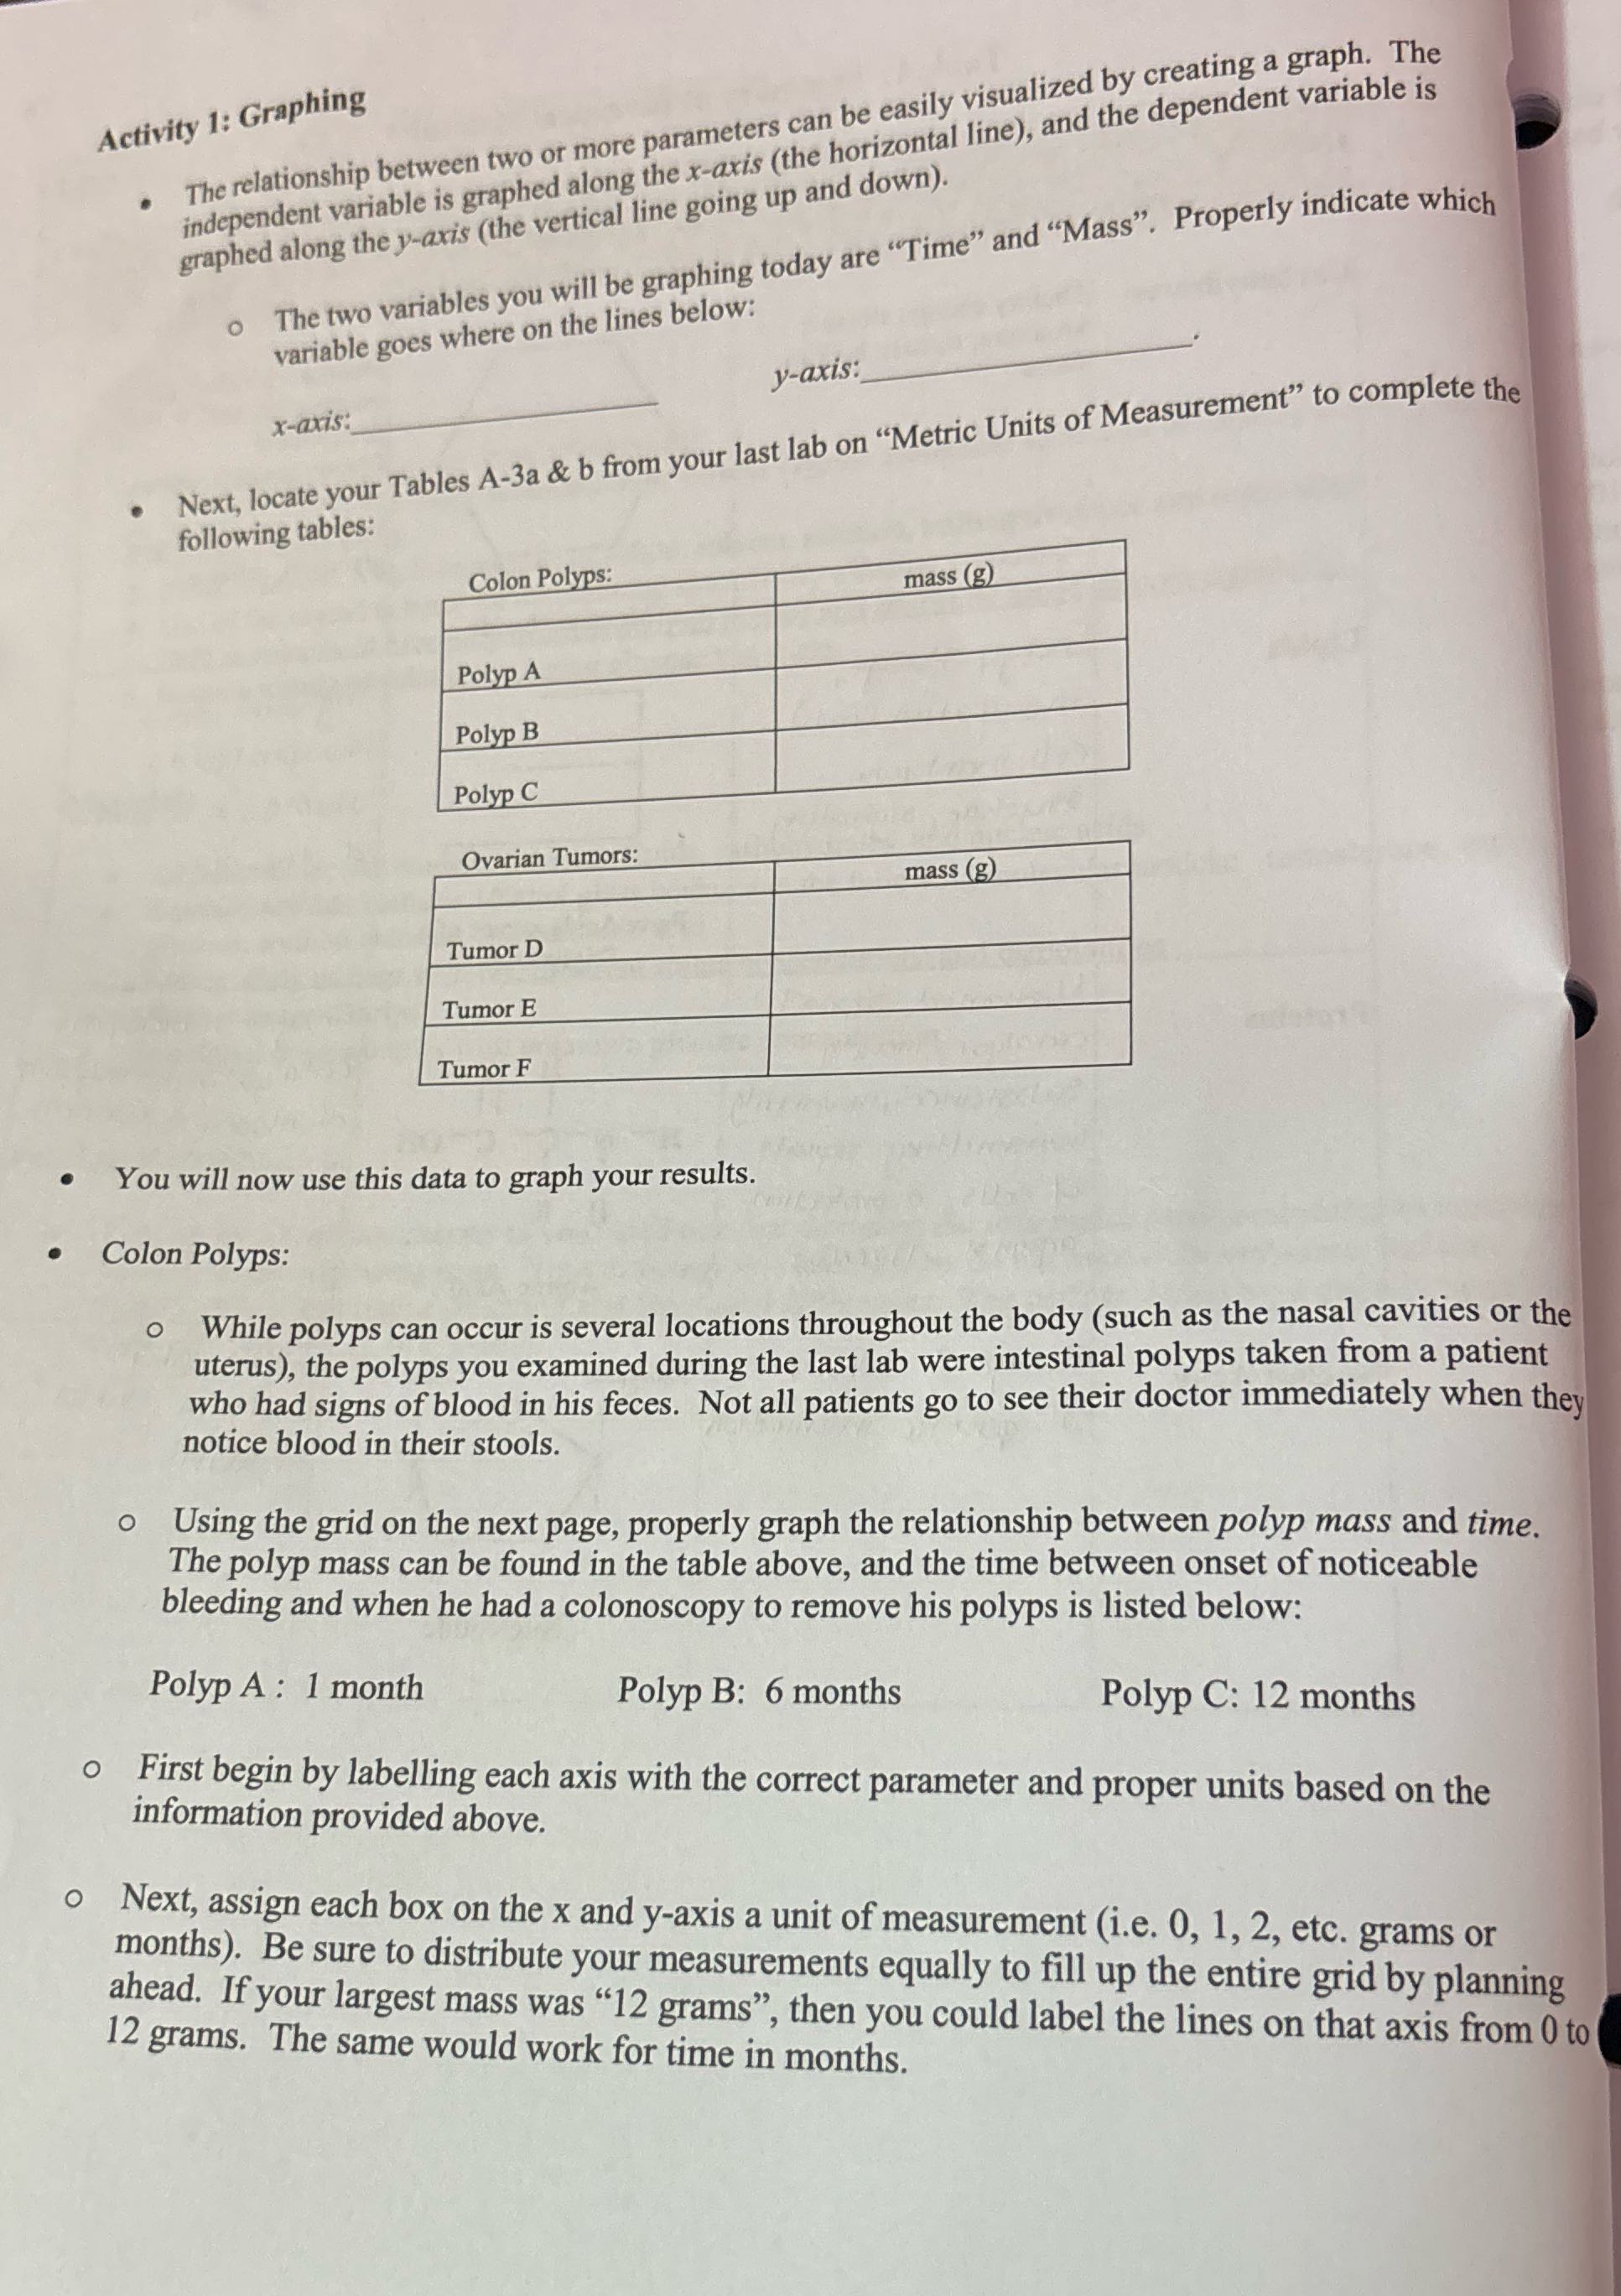 Activity 1: Graphing The relationship between two or more parameters can be easily visualized by creating a graph. The independent variable is graphed along the x-axis (the horizontal line), and the dependent variable is graphed along the y-axis (the vertical line going up and down). o The two variables you will be graphing today are "Time" and "Mass". Properly indicate which variable goes where on the lines below: y-axis: x-axis: Next, locate your Tables A-3a
 Step by Step Solution
There are 3 Steps involved in it
1 Expert Approved Answer
Step: 1 Unlock

Question Has Been Solved by an Expert!
Get step-by-step solutions from verified subject matter experts
Step: 2 Unlock
Step: 3 Unlock