

Question: Using the graph below, determine the profit-maximizing price and quantity to produce. Price $100 $80 $60 $40 $20 MC 20 40 60 80 100 Quantity
Using the graph below, determine the profit-maximizing price and quantity to produce.
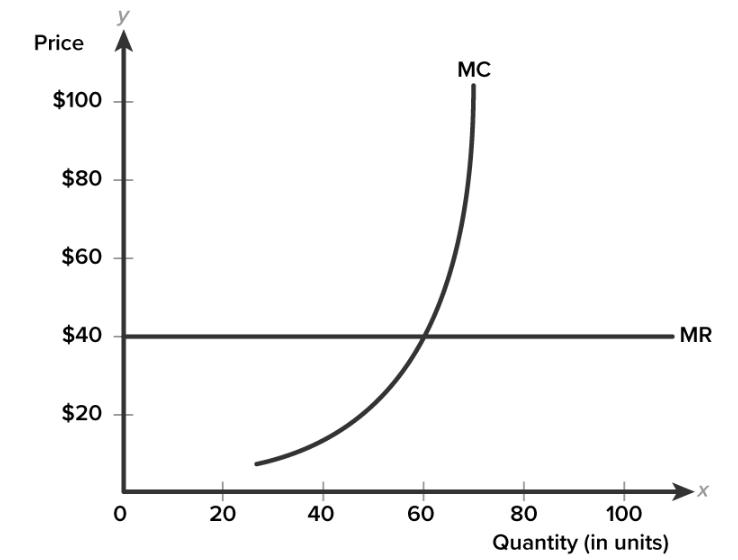
Price $100 $80 $60 $40 $20 MC 20 40 60 80 100 Quantity (in units)
Step by Step Solution
★★★★★
3.37 Rating (153 Votes )
There are 3 Steps involved in it
1 Expert Approved Answer
Step: 1 Unlock

The marginal cost MC curve shows the additional cost of producing one more unit of output It typical... View full answer
Question Has Been Solved by an Expert!
Get step-by-step solutions from verified subject matter experts
Step: 2 Unlock
Step: 3 Unlock