

Question: Histroical Stock Performance Data Stock Expected return Standard deviation of returns CAPM Beta A B C 7% 8% 12% Market 8% Treasuries 4% 26%
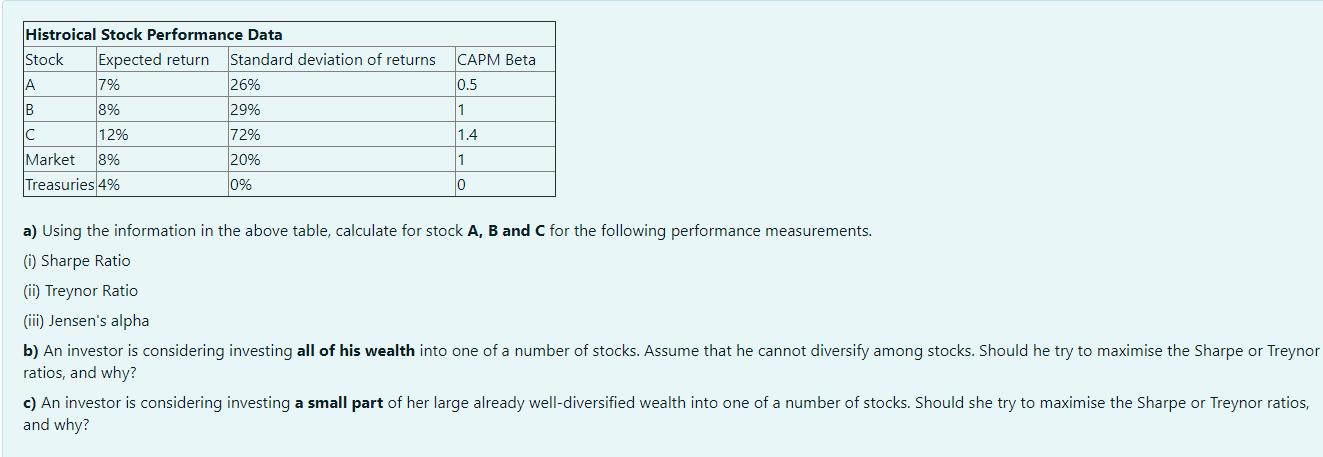
Histroical Stock Performance Data Stock Expected return Standard deviation of returns CAPM Beta A B C 7% 8% 12% Market 8% Treasuries 4% 26% 29% 72% 20% 0% 0.5 1 1.4 1 0 a) Using the information in the above table, calculate for stock A, B and C for the following performance measurements. (i) Sharpe Ratio (ii) Treynor Ratio (iii) Jensen's alpha b) An investor is considering investing all of his wealth into one of a number of stocks. Assume that he cannot diversify among stocks. Should he try to maximise the Sharpe or Treynor ratios, and why? c) An investor is considering investing a small part of her large already well-diversified wealth into one of a number of stocks. Should she try to maximise the Sharpe or Treynor ratios, and why?
Step by Step Solution
3.32 Rating (146 Votes )
There are 3 Steps involved in it
a i Sharpe Ratio A 7 4 26 015 B 8 4 29 014 C 12 4 ... View full answer

Get step-by-step solutions from verified subject matter experts