

Question: https:/g.cengage.com/spreadsheet/wac_frame.jsp C + A Content C MindTap - Cengage Learning C Excel Online Student Work b Success Confirmation of Question Submission | bartleby X template
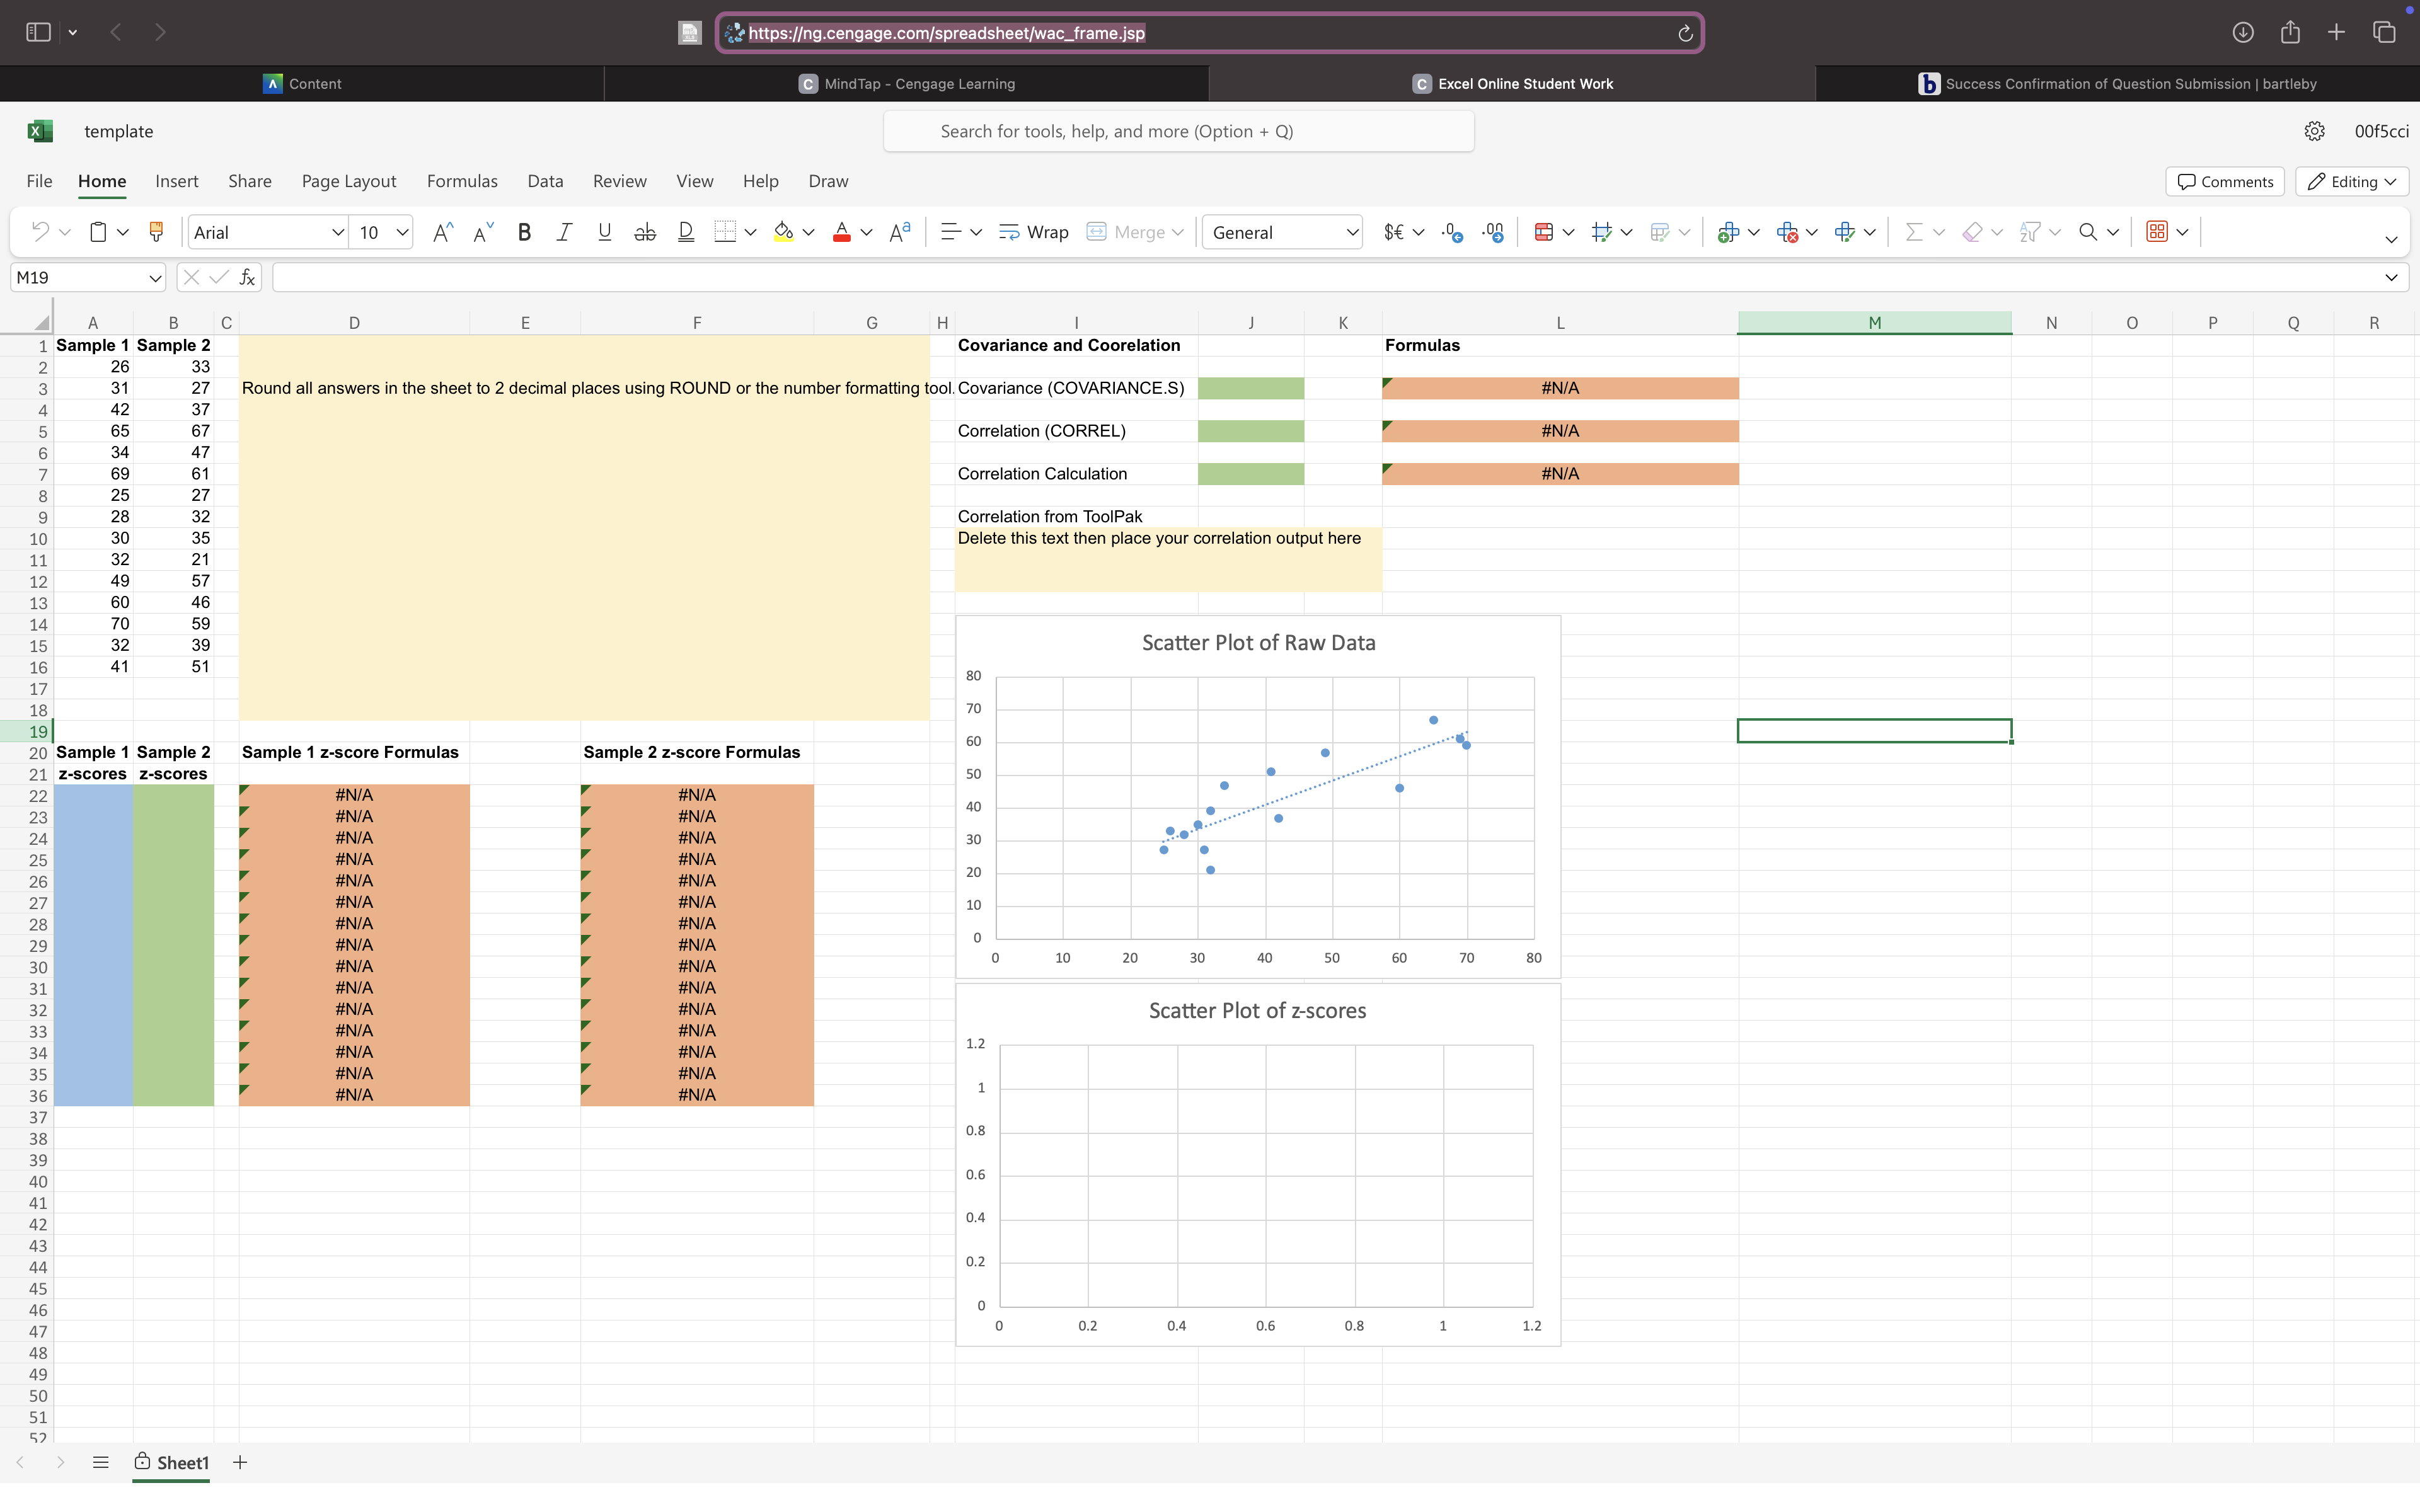
 https:/g.cengage.com/spreadsheet/wac_frame.jsp C + A Content C MindTap - Cengage Learning C Excel Online Student Work b Success Confirmation of Question Submission | bartleby X template Search for tools, help, and more (Option + Q) 0of5cci File Home Insert Share Page Layout Formulas Data Review View Help Draw Comments Editing v by Ov Arial 10 A" A" B I U ab D v Ov Av Aa = v Wrap Merge General M19 V X V fx B C G H K M N P Q R Sample 1 Sample 2 Covariance and Coorelation Formulas 26 33 31 27 Round all answers in the sheet to 2 decimal places using ROUND or the number formatting tool. Covariance (COVARIANCE.S) #N/A 42 37 65 67 Correlation (CORREL) #N/A 5 6 0 VOUIA WN 34 47 69 61 Correlation Calculation #N/A 25 27 28 32 Correlation from ToolPak 30 35 Delete this text then place your correlation output here 11 32 21 12 49 13 60 46 14 70 59 15 32 Scatter Plot of Raw Data 41 51 80 20 Sample 1 Sample 2 Sample 1 z-score Formulas Sample 2 z-score Formulas 21 z-scores z-scores 22 #N/A #N/A #N/A #N/A #N/A #N/A #NIA #N/A #N/A #N/A #NIA #N/A #NIA #N/A #N/A #N/A 10 20 30 40 50 60 70 80 #N/A #N/A #N/A #N/A #NIA #N/A Scatter Plot of z-scores #N/A #N/A #N/A #N/A 1.2 #NIA #N/A #N/A #N/A 1 0.8 0.6 0.4 0.2 0 0.2 0.4 0.6 0.8 1.2 = O Sheet1 +V
Step by Step Solution
There are 3 Steps involved in it

Get step-by-step solutions from verified subject matter experts