

Question: is this right? V Sample data Calculations X y ( x - 7 ) 2 ( 1 - J ) 2 ( V - 7
is this right?
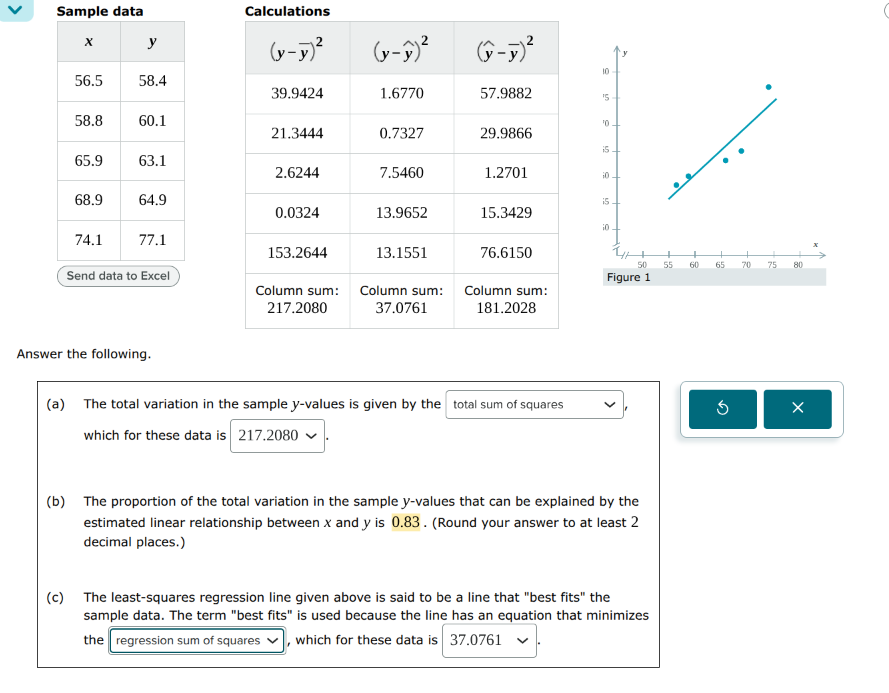 V Sample data Calculations X y ( x - 7 ) 2 ( 1 - J ) 2 ( V - 7 ) 2 10 56.5 58.4 39.9424 1.6770 57.9882 IS 58.8 60.1 21.3444 0.7327 29.9866 65.9 63.1 2.6244 7.5460 1.2701 68.9 64.9 is 0.0324 13.9652 15.3429 74.1 77.1 153.2644 13.1551 76.6150 50 55 60 65 70 75 80 Send data to Excel Figure 1 Column sum: Column sum: Column sum: 217.2080 37.0761 181.2028 Answer the following. (a) The total variation in the sample y-values is given by the total sum of squares 5 X which for these data is 217.2080 (b) The proportion of the total variation in the sample y-values that can be explained by the estimated linear relationship between x and y is 0.83 . (Round your answer to at least 2 decimal places.) (c) The least-squares regression line given above is said to be a line that "best fits" the sample data. The term "best fits" is used because the line has an equation that minimizes the regression sum of squares v which for these data is 37.0761 v
Step by Step Solution
There are 3 Steps involved in it
1 Expert Approved Answer
Step: 1 Unlock

Question Has Been Solved by an Expert!
Get step-by-step solutions from verified subject matter experts
Step: 2 Unlock
Step: 3 Unlock