

Question: signatures ) . Figure 5 . 5 : Records with late and unsigned physician orders Create a p chart showing the weekly results over the
signatures
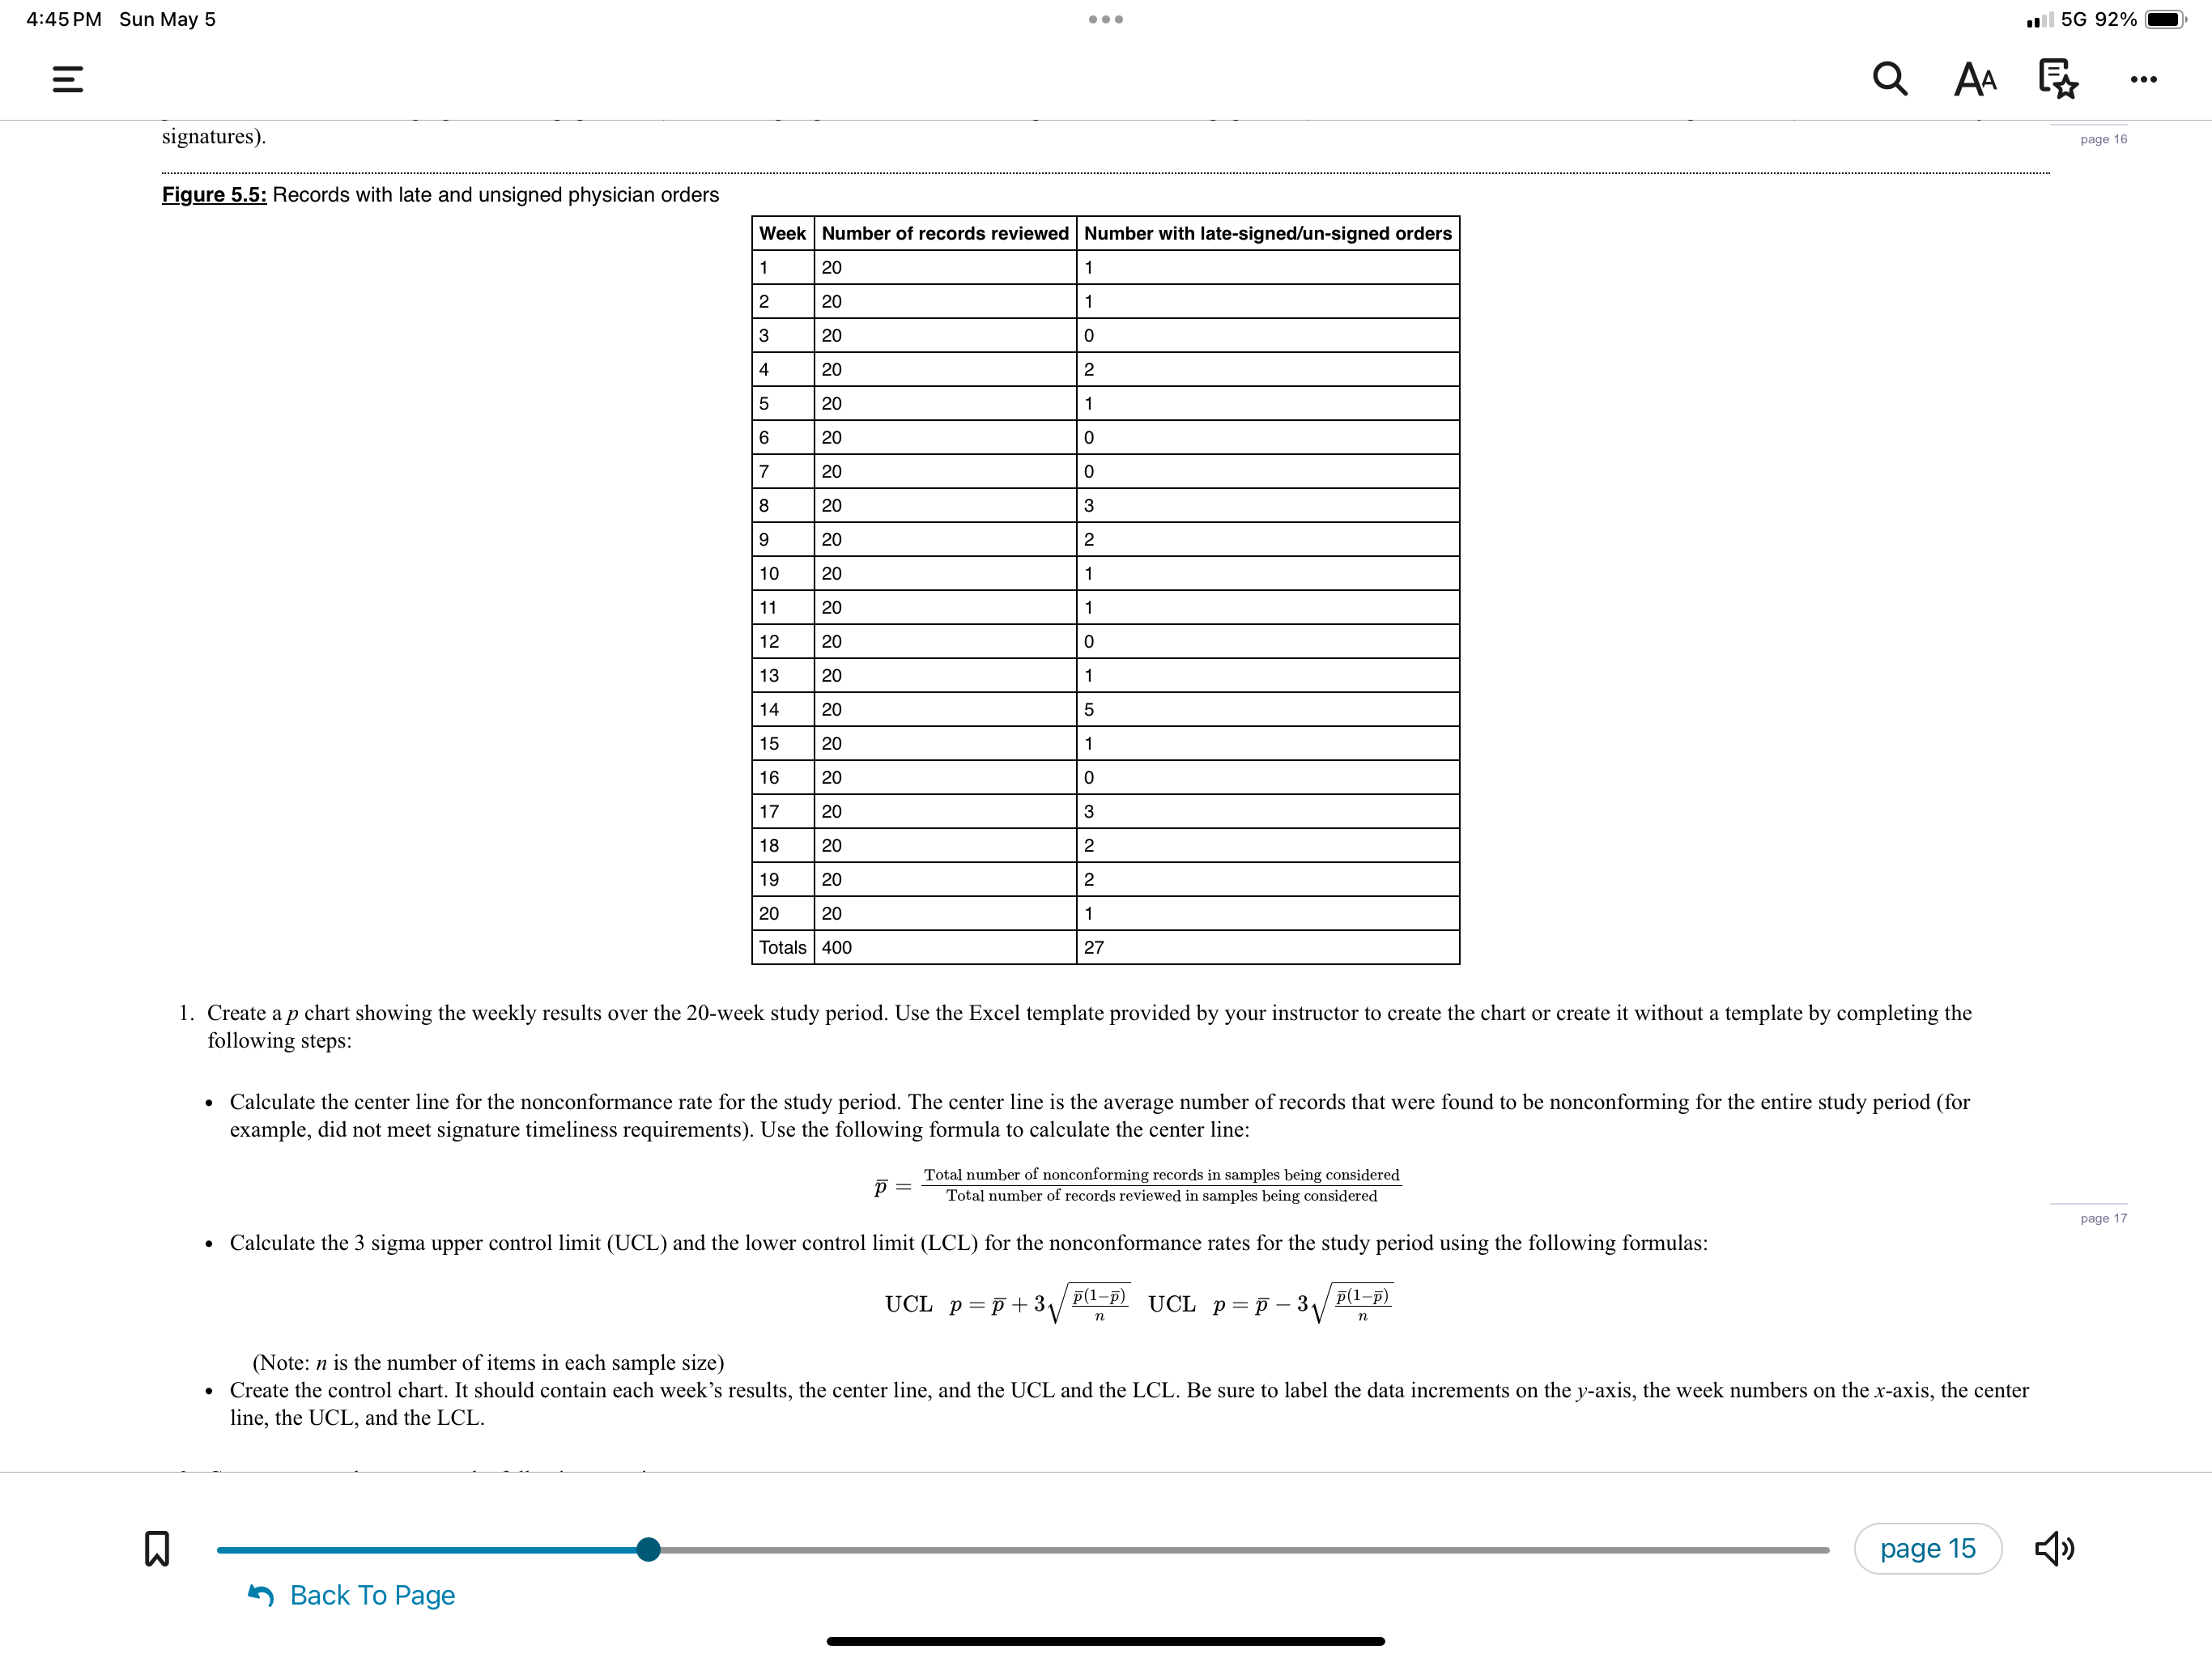
Figure : Records with late and unsigned physician orders
Create a chart showing the weekly results over the week study period. Use the Excel template provided by your instructor to create the chart or create it without a template by completing the
following steps:
Calculate the center line for the nonconformance rate for the study period. The center line is the average number of records that were found to be nonconforming for the entire study period for
example, did not meet signature timeliness requirements Use the following formula to calculate the center line:
Calculate the sigma upper control limit UCL and the lower control limit LCL for the nonconformance rates for the study period using the following formulas:
UCLpUCLp
Note: is the number of items in each sample size
Create the control chart. It should contain each week's results, the center line, and the UCL and the LCL Be sure to label the data increments on the axis, the week numbers on the axis, the center
line, the UCL, and the LCL
Step by Step Solution
There are 3 Steps involved in it
1 Expert Approved Answer
Step: 1 Unlock

Question Has Been Solved by an Expert!
Get step-by-step solutions from verified subject matter experts
Step: 2 Unlock
Step: 3 Unlock