

Question: TO DO a. Over the relevant ranges noted in the following table, calculate the after-tax cost of each source of financing needed to complete
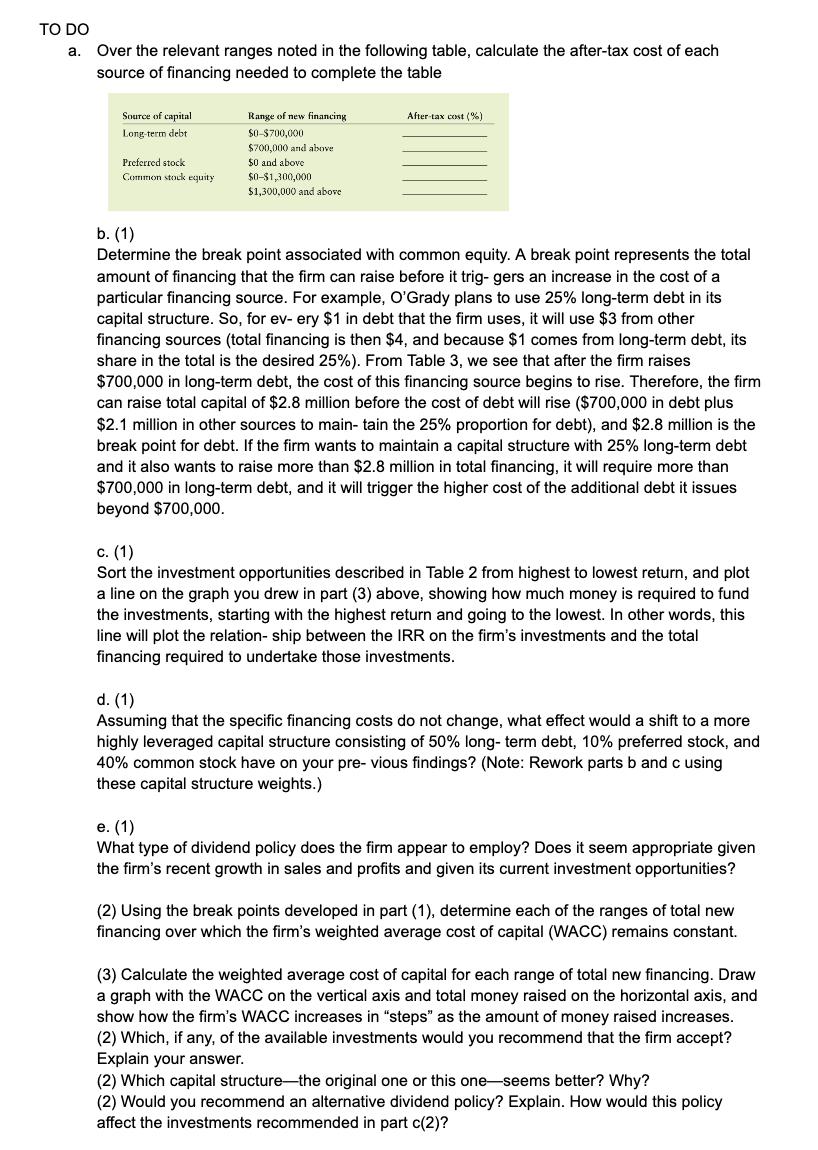
TO DO a. Over the relevant ranges noted in the following table, calculate the after-tax cost of each source of financing needed to complete the table Source of capital Long-term debt Preferred stock Common stock equity Range of new financing $0-$700,000 $700,000 and above. $0 and above $0-$1,300,000 $1,300,000 and above After-tax cost (%) b. (1) Determine the break point associated with common equity. A break point represents the total amount of financing that the firm can raise before it trig- gers an increase in the cost of a particular financing source. For example, O'Grady plans to use 25% long-term debt in its capital structure. So, for ev- ery $1 in debt that the firm uses, it will use $3 from other financing sources (total financing is then $4, and because $1 comes from long-term debt, its share in the total is the desired 25%). From Table 3, we see that after the firm raises $700,000 in long-term debt, the cost of this financing source begins to rise. Therefore, the firm can raise total capital of $2.8 million before the cost of debt will rise ($700,000 in debt plus $2.1 million in other sources to main- tain the 25% proportion for debt), and $2.8 million is the break point for debt. If the firm wants to maintain a capital structure with 25% long-term debt and it also wants to raise more than $2.8 million in total financing, it will require more than $700,000 in long-term debt, and it will trigger the higher cost of the additional debt it issues beyond $700,000. c. (1) Sort the investment opportunities described in Table 2 from highest to lowest return, and plot a line on the graph you drew in part (3) above, showing how much money is required to fund the investments, starting with the highest return and going to the lowest. In other words, this line will plot the relationship between the IRR on the firm's investments and the total financing required to undertake those investments. d. (1) Assuming that the specific financing costs do not change, what effect would a shift to a more highly leveraged capital structure consisting of 50% long-term debt, 10% preferred stock, and 40% common stock have on your pre- vious findings? (Note: Rework parts b and c using these capital structure weights.) e. (1) What type of dividend policy does the firm appear to employ? Does it seem appropriate given the firm's recent growth in sales and profits and given its current investment opportunities? (2) Using the break points developed in part (1), determine each of the ranges of total new financing over which the firm's weighted average cost of capital (WACC) remains constant. (3) Calculate the weighted average cost of capital for each range of total new financing. Draw a graph with the WACC on the vertical axis and total money raised on the horizontal axis, and show how the firm's WACC increases in "steps" as the amount of money raised increases. (2) Which, if any, of the available investments would you recommend that the firm accept? Explain your answer. (2) Which capital structure-the original one or this one-seems better? Why? (2) Would you recommend an alternative dividend policy? Explain. How would this policy affect the investments recommended in part c(2)?
Step by Step Solution
3.38 Rating (160 Votes )
There are 3 Steps involved in it
a Here are the aftertax costs of each source of financing based on the given ranges Source of capita... View full answer

Get step-by-step solutions from verified subject matter experts