

The figure below shows data on the average price of used cars and trucks (blue dashed line)
Fantastic news! We've Found the answer you've been seeking!
Question:
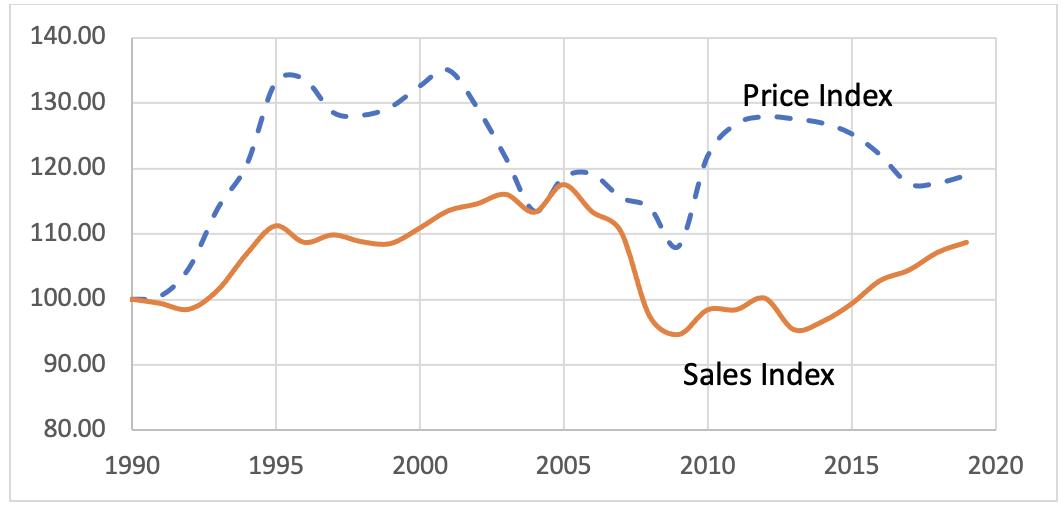
The figure below shows data on the average price of used cars and trucks (blue dashed line) and an index of the number of sales of such vehicles (orange solid line). The index is created so that the value of each is 100 in 1990, so the value of the index compares price to 1990. For example, the sales index in 1995 is about 111, which means sales were 11% higher in 1995 than in 1990.
Consider the time from about 1992 to 1995.
- Suppose only supply or demand has changed during this time. What shift is consistent with the data? Identify which curve and in which direction. Briefly explain.
- One of the curves did not shift. Do the changes in the price and sales indices imply that the curve that did not shift is elastic or inelastic? Explain.
- Draw a graph consistent with your answers to parts a and b.
Expert Answer:
Answer A From this figure we can see that the value onceover is remarkably high for the tradein vehi... View the full answer

Related Book For 

Posted Date:
