

A chemical company has collected 15 daily subgroups of measurements of an important chemical property called acid
Question:
A chemical company has collected 15 daily subgroups of measurements of an important chemical property called "acid value" for one of its products. Each subgroup consists of six acid value readings: a single reading was taken every four hours during the day, and the readings for a day are taken as a subgroup. The 15 daily subgroups are given in Table 17.8.
TABLE 17.8
15 Subgroups of Acid Value Measurements for a Chemical Process
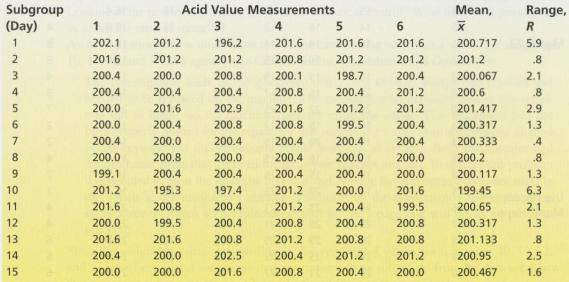
a. Show that for these data x̅̅ = 200.529 and = 2.06.
b. Set up x̅ and R charts for the acid value data. Are these charts in statistical control?
c. On the basis of these charts, is it possible to draw proper conclusions about whether the mean acid value is changing? Explain why or why not.
d. Suppose that investigation reveals that the out-of-control points on the R chart (the ranges for subgroups l and 10) were caused by an equipment malfunction that can be remedied by redesigning a mechanical part. Since the assignable cause that is responsible for the large ranges for subgroups l and 10 has been found and eliminated, we can remove subgroups 1 and 10 from the data set. Show that using the remaining 13 subgroups gives revised center lines of x̅̅ = 200.5975 and = 1.4385.
e. Use the revised values of x̅̅ and to compute revised x̅ and R chart control limits for the acid value data. Set up the revised x̅ and R charts, making sure to omit subgroup means and ranges for subgroups 1 and 10.
f. Are the revised x̅ and R charts for the remaining 13 subgroups in statistical control? Explain. What does this result tell us to do?
Step by Step Answer:
a b d Monc a 202 0 2015 2010 200 5 V 2000 O no f ALUE KEDO R n 9 200717 20...View the full answer


Business Statistics In Practice
ISBN: 9780073401836
6th Edition
Authors: Bruce Bowerman, Richard O'Connell
