

Question: A food processor was receiving complaints from its customers about the firmness of its canned sweet potatoes. The firm's research scientist decided to conduct an
A food processor was receiving complaints from its customers about the firmness of its canned sweet potatoes. The firm's research scientist decided to conduct an experiment to determine if adding pectin to the sweet potatoes might result in a product with a more desirable firmness. The experiment was designed using three concentrations of pectin (by weight)-1%, 2%, and 3%- and a control with 0%. The processor packed 12 cans with sweet potatoes with a 25% (by weight) sugar solution. Three cans were randomly assigned to each of the pectin concentrations with the appropriate percentage of pectin added to the sugar syrup. The cans were sealed and placed in a 25° C environment for 30 days. At the end of the storage time, the cans were opened, and a firmness determination was made for the contents of each can. These appear below: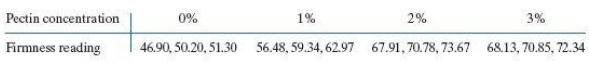
a. Let x denote the pectin concentration of the sweet potatoes in a can and y denote the firmness reading following the 30 days of storage at 25° C. Plot the sample data in a scatter diagram.
b. Obtain the least- squares estimates for the parameters, and plot the least- squares line on your scatter diagram.
c. Does firmness appear to be in a constant increasing relation with pectin concentration?
d. Predict the firmness of a can of sweet potatoes treated with a 1.5% concentration of pectin (by weight) after 30 days of storage at 25° C.
Pectin concentration 0% 1% 2% 3% Firmness reading 46.90, 50.20, 51.30 56.48, 59.34, 62.97 67.91, 70.78, 73.67 68.13, 70.85, 72.34
Step by Step Solution
3.61 Rating (166 Votes )
There are 3 Steps involved in it
a The following is a scatterplot of the data values with the regressio... View full answer

Get step-by-step solutions from verified subject matter experts
Document Format (1 attachment)
595-M-S-L-R (5044).docx
120 KBs Word File