

Question: A random sample of 100 consumers is selected to help determine consumer preferences for two proposed new soft drink flavors. Results from the sample appear
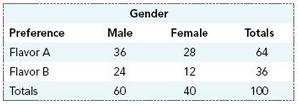
A random sample of 100 consumers is selected to help determine consumer preferences for two proposed new soft drink flavors. Results from the sample appear below:
Use a chi square test of independence to test a null hypothesis that flavor preference is independent of gender for the population represented here. Use a significance level of 5% for your test.
Gender Preference Flavor A Flavor B Totals Male 36 24 60 Female 28 12 40 Totals 64 36 100
Step by Step Solution
3.47 Rating (170 Votes )
There are 3 Steps involved in it
Step 1 Step 2 Calculate expected frequencies Step 3 Compute the x 2 stat ... View full answer

Get step-by-step solutions from verified subject matter experts
Document Format (1 attachment)
486-M-S-C-S-T (189).docx
120 KBs Word File