

Question: (a) Use Excel to prepare a 2-D stacked column chart for television sales by year. Modify the colors, fonts, etc., to make the display effective.
(a) Use Excel to prepare a 2-D stacked column chart for television sales by year. Modify the colors, fonts, etc., to make the display effective.
(b) Change your graph to a 3-D stacked column chart. Modify the chart if necessary to make it attractive.
(c) Is 3-D better than 2-D? Why?
(d) Right-click the data series, choose Add Data Labels, and add labels to the data. Do the labels help?
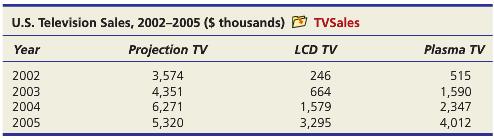
U.S. Television Sales, 2002-2005 ($ thousands) E TVSales Year Projection TV LCD TV Plasma TV 2002 2003 2004 2005 3,574 4,351 6,271 5,320 246 664 1,579 3,295 515 1,590 2,347 4,012
Step by Step Solution
3.38 Rating (160 Votes )
There are 3 Steps involved in it
a b c Many individuals will see the 3D as more distracting When there are several graphs in ... View full answer

Get step-by-step solutions from verified subject matter experts
Document Format (1 attachment)
485-M-S-D-A (3037).docx
120 KBs Word File