

A whatjapanthinks.com survey asked residents of Japan to name their favorite pizza topping. The possible responses included
Question:
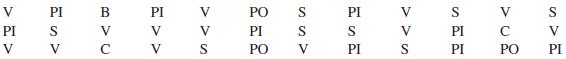
a. Prepare a frequency distribution table.
b. Calculate the relative frequencies and percentages for all categories.
c. What percentage of the respondents mentioned vegetables and fruits, poultry, or cheese?
d. Draw a bar graph for the relative frequency distribution.
The word "distribution" has several meanings in the financial world, most of them pertaining to the payment of assets from a fund, account, or individual security to an investor or beneficiary. Retirement account distributions are among the most...
Fantastic news! We've Found the answer you've been seeking!
Step by Step Answer:
a and b Category Frequency Relative Frequency Percentage PI 9 936 ...View the full answer

Answered By
Muqadas Javed
I am a mentor by profession since seven years. I have been teaching on online forums and in universities. Teaching is my passion therefore i always try to find simple solution for complicated problems or task grasp them so that students can easily grasp them.I will provide you very detailed and self explanatory answers and that will help you to get good grade. I have two slogans: quality solution and on time delivery.
24+ Reviews
144+ Question Solved
Related Book For 

Question Posted:
