

Question: An experimental bumper was designed to reduce damage in low-speed collisions. This bumper was installed on an experimental group of vans in a large feet,
An experimental bumper was designed to reduce damage in low-speed collisions. This bumper was installed on an experimental group of vans in a large feet, but not on a control group. At the end of a trial period, accident data showed 12 repair incidents for the experimental group and 9 repair incidents for the control group. Vehicle downtime (in days per repair incident) is shown below. At α = .05, did the new bumper reduce downtime?
(a) Make stacked dot plots of the data (a sketch is OK).
(b) State the hypotheses.
(c) State the decision rule and sketch it.
(d) Find the test statistic.
(e) Make a decision.
(f) Find the p-value and interpret it.
(g) Do you think the difference is large enough to be important? Explain.
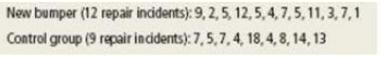
New bumper (12 repair incidents): 9,2,5,12,5,4,7,5,11,3,7,1 Control group (9 repair incidents):7,5,7,4, 18,4,8,14,13
Step by Step Solution
3.44 Rating (170 Votes )
There are 3 Steps involved in it
a New Bumper Control Group b Assume 1 is the average repa... View full answer

Get step-by-step solutions from verified subject matter experts
Document Format (1 attachment)
485-M-S-H-T (1856).docx
120 KBs Word File