

Question: Below is a table showing 100-meter finish times (in seconds) for 35 competitors at the NCAA Division III Track and Field Championships recently held in
Below is a table showing 100-meter finish times (in seconds) for 35 competitors at the NCAA Division III Track and Field Championships recently held in Muncie, Indiana.
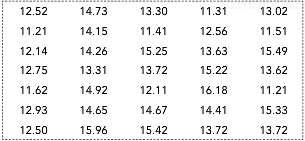
a. Create a stem-and-leaf diagram to display the data using two leading digits to form the stem. Use a leaf unit of .1. Retain the original order when entering the leaf values.
b. Produce an ordered stem-and-leaf diagram by putting the leaf values in ascending order.
11.31 13.02 13.30 11.21 15 12.56 1.51 12.14 26 15.25 13.63 15.49 12.75 13.3 13.725.22 13.62 11.62 14.92 .8 1.21 12.93 4.65 14.67 144115.33 12.50 5 15.42 13.72 13.72 14.73 16.18
Step by Step Solution
★★★★★
3.47 Rating (177 Votes )
There are 3 Steps involved in it
1 Expert Approved Answer
Step: 1 Unlock

a leaf unit 01 b lea... View full answer
Question Has Been Solved by an Expert!
Get step-by-step solutions from verified subject matter experts
Step: 2 Unlock
Step: 3 Unlock
Document Format (1 attachment)
486-M-S-S-I (1161).docx
120 KBs Word File