

Question: Below we give the average hourly outdoor temperature (x) in a city during a week and the citys natural gas consumption (y) during the week
Below we give the average hourly outdoor temperature (x) in a city during a week and the city€™s natural gas consumption (y) during the week for each of eight weeks (the temperature readings are expressed in degrees Fahrenheit and the natural gas consumptions are expressed in millions of cubic feet of natural gas€” denoted MMcf). The output to the right of the data is obtained when MINITAB is used to fit a least squares line to the natural gas consumption data.
-1.png)
It can be shown that for the gas consumption data:
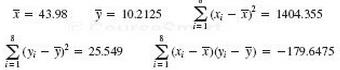
a. Calculate and r.
b. Using the formulas on page 128, calculate the values and on the MINITAB output.
c. Find a prediction of the natural gas consumption during a week when the average hourly temperature is 40 Fahrenheit.
Average Hourly Temperature, x (oF) 28.0 28.0 32.5 39.0 45.9 57.8 58.1 62.5 Weekly Natural Gas Consumption, y (MMcf) 12.4 11.7 12.4 10.8 Best Fit Line for Gas Consumption Data Week GasCons 15.84 0.1279 Temp 13 12 9.4 9.5 8.0 6 10 CO Gascon 1 8 7 30 40 50 60 Temp, X -=43.98 y = 10.2 125 (Xi- 2-1404.355 (y;2 = 25.549 (xi-T)OS-v) =-179.6475
Step by Step Solution
3.43 Rating (166 Votes )
There are 3 Steps involved in it
a b b 1 s xy sx 2 256239141641 2 01279 b 0 y b 1 x 102125 01279 4... View full answer

Get step-by-step solutions from verified subject matter experts
Document Format (1 attachment)
458-M-C-M-S (213).docx
120 KBs Word File