

Question: Calculate SS Regression (c), SS Error (d), MS Regression (e), MS Error (f), and F (g). Use the F value to test the hypothesis that
Calculate SS Regression (c), SS Error (d), MS Regression (e), MS Error (f), and F (g). Use the F value to test the hypothesis that all βs are0, at the 5% significance level.
You have been conducting a study of supermarket sales of ProDay energy bars. The table below shows partial results of a multiple linear regression analysis intended to link monthly sales to two independent variables: the width of the display space (in inches) allotted to the product (x1) and the height (in inches) above floor level of the shelf on which the product is displayed. (x2).
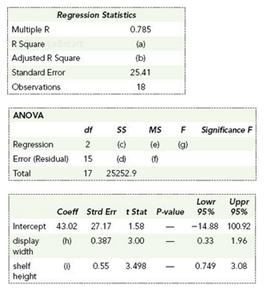
Regression Statistics Multiple R R Square Adjusted R Square Standard Error Observations 0.785 b) 25.41 18 ANOVA df 55 MS FSignifkance F Regression 2)e)(g) Emor (Residua) d Total 17 252529 Lowr Uppr coeff Strd Err tStat P-value 95% 9S% Intercept 4302 277 8 1488 10092 display 0387 3.00.33 1.96 width shelf height 0 SS 3498 0749 308
Step by Step Solution
3.33 Rating (180 Votes )
There are 3 Steps involved in it
c r2 so SSR r2SST 616252529 155558 d SST SSR SSE so SSE SST SSR 252529 155558 96971 e MSR 77779 ... View full answer

Get step-by-step solutions from verified subject matter experts
Document Format (1 attachment)
486-M-S-L-R (3098).docx
120 KBs Word File