

Comcasts customer service department asks its customers to rate their over the phone service on a scale
Question:
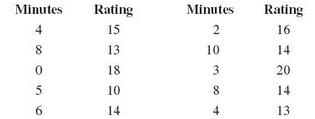
Comcast’s customer service department asks its customers to rate their over the phone service on a scale of 1–20 immediately after their service has been completed. The company then matches each customer’s rating with the number of minutes the person waited on hold. The following table shows the ratings and number of minutes on hold for 10 randomly selected customers. These data can also be found in the Excel file hold.xlsx.
a. Construct a scatter plot for these data.
b. Calculate the slope and the y intercept for the regression equation.
c. Provide an interpretation for the value of the slope.
d. Calculate the SST.
e. Partition the SST into the SSR and SSE.
Fantastic news! We've Found the answer you've been seeking!
Step by Step Answer:
a b c Because the slope is negative we can conclude that a one m...View the full answer

Answered By
Utsab mitra
I have the expertise to deliver these subjects to college and higher-level students. The services would involve only solving assignments, homework help, and others.
I have experience in delivering these subjects for the last 6 years on a freelancing basis in different companies around the globe. I am CMA certified and CGMA UK. I have professional experience of 18 years in the industry involved in the manufacturing company and IT implementation experience of over 12 years.
I have delivered this help to students effortlessly, which is essential to give the students a good grade in their studies.
2+ Reviews
10+ Question Solved
Related Book For 

Question Posted:
