

Question: Comparative financial statement data of Main Street Antiques Ltd. appear below: Other information: Market price of Main Street Antiques Ltd. common shares: $24.00 at
Comparative financial statement data of Main Street Antiques Ltd. appear below:
Other information:
• Market price of Main Street Antiques Ltd. common shares: $24.00 at December 31, 2014, and $12.00 at December 31, 2012.
• Common shares outstanding: 10,000 during 2014 and 7,500 during 2013. There are 1,000 preferred shares outstanding at December 31, 2014 and 2013.
• All sales are on credit.
Required
1. Compute the following ratios for 2014 and 2013:
a. Current ratio
b. Inventory turnover
c. Accounts-receivable turnover
d. Times-interest-earned ratio
e. Return on assets
f. Return on common shareholders’ equity
g. Earnings per common share
h. Price/earnings ratio
i. Book value per common share at year end
2. Decide (a) whether Main Street Antiques Ltd.’s financial position improved or deteriorated during 2014, and (b) whether the investment attractiveness of its common shares appears to have increased or decreased.
3. How will what you have learned in this problem help you evaluate an investment?
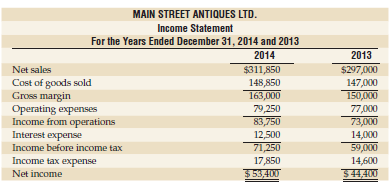
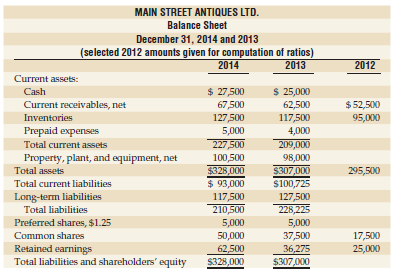
MAIN STREET ANTIQUES LTD Income Statement For the Years Ended December 31, 2014 and 2013 Net sales Cost of goods sold Gross margin 2014 $311,850 148,850 163,000 9,250 2013 $297,000 147,000 150,000 77,000 Income from operations Interest expense Income before income tax Income tax expense Net income 12,500 14,000 14,600 $44,400 17,850 $53,400 MAIN STREET ANTIQUES LTD Balance Sheet December 31, 2014 and 2013 (selected 2012 amounts given for computation of ratios) 2014 2013 Current assets: Cash 27,500 25,000 62,500 117,500 4,000 Current receivables, net 67,500 127,500 5,000 $52,500 95,000 Prepaid expenses Total current assets Property, plant, and equipment, net 227,500 209, 100,500 98,000 Total assets Total current liabilities 295,500 Total liabilities Preferred shares, $1.25 Common shares Retained earnings $93,000 117,500 210,500 5,000 50,000 $100,725 127,500 228,225 5,000 37,500 17,500 25,000 62 Total liabilities and shareholders equity$328,000 $307,000
Step by Step Solution
3.27 Rating (165 Votes )
There are 3 Steps involved in it
Req 1 Not in thousands Req2 Decisions a The companys financial position improved during 2014 as show... View full answer

Get step-by-step solutions from verified subject matter experts
Document Format (1 attachment)
1147-B-M-A-S-O-C-F(4425).docx
120 KBs Word File