

Question: Comparative statement data for Douglas Company and Maulder Company, two competitors, appear below. All balance sheet data are as of December 31, 2011, and December
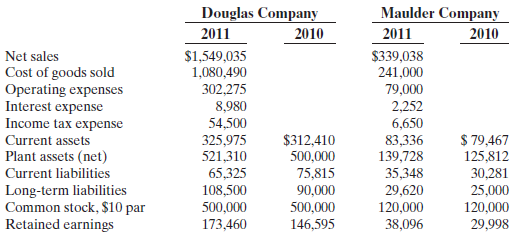
Comparative statement data for Douglas Company and Maulder Company, two competitors, appear below. All balance sheet data are as of December 31, 2011, and December 31, 2010.
Instructions
(a) Prepare a vertical analysis of the 2011 income statement data for Douglas Company and Maulder Company in columnar form.
(b) Comment on the relative profitability of the companies by computing the return on assets and the return on common stockholders’ equity ratios for both companies.
Douglas Company Maulder Company 2011 2010 2011 2010 $1,549,035 1,080,490 302,275 8,980 54,500 $339,038 241,000 79,000 Net sales Cost of goods sold Operating expenses Interest expense Income tax expense Current assets 2,252 6,650 $ 79,467 $312,410 500,000 325,975 521,310 83,336 139,728 Plant assets (net) 125,812 Current liabilities Long-term liabilities Common stock, $10 par Retained earnings 65,325 75,815 35,348 30,281 25,000 120,000 108,500 500,000 173,460 90,000 500,000 29,620 120,000 146,595 38,096 29,998
Step by Step Solution
3.37 Rating (172 Votes )
There are 3 Steps involved in it
a Condensed Income Statement For the Year Ended December 31 2011 Douglas Company Maulder Company Dol... View full answer

Get step-by-step solutions from verified subject matter experts
Document Format (1 attachment)
47-B-A-F-S (120).docx
120 KBs Word File