

Question: Compute the range and standard deviation for the data presented in problem 3.14. The data are reproduced here. What would happen to the value of
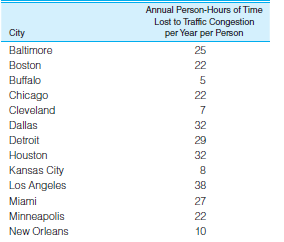
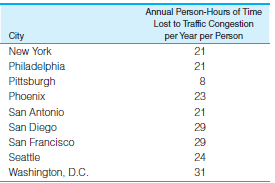
Annual Person-Hours of Time Lost to Traffic Congestion per Year per Person City Baltimore 25 22 Boston Buffalo Chicago 22 Cleveland Dallas 32 Detroit 29 Houston 32 Kansas City 8. Los Angeles 38 Miami 27 Minneapolis 22 New Orleans 10
Step by Step Solution
★★★★★
3.41 Rating (148 Votes )
There are 3 Steps involved in it
1 Expert Approved Answer
Step: 1 Unlock

R 385 or 33 s 898 The score for Los Angeles 3... View full answer
Question Has Been Solved by an Expert!
Get step-by-step solutions from verified subject matter experts
Step: 2 Unlock
Step: 3 Unlock
Document Format (1 attachment)
757-M-S-H-T (4496).docx
120 KBs Word File