

Question: Condensed balance sheet and income statement data for Fellenz Corporation are presented below. InstructionsCompute the following values and ratios for 2011 and 2012.(a) Earnings per
Condensed balance sheet and income statement data for Fellenz Corporation are presented below.
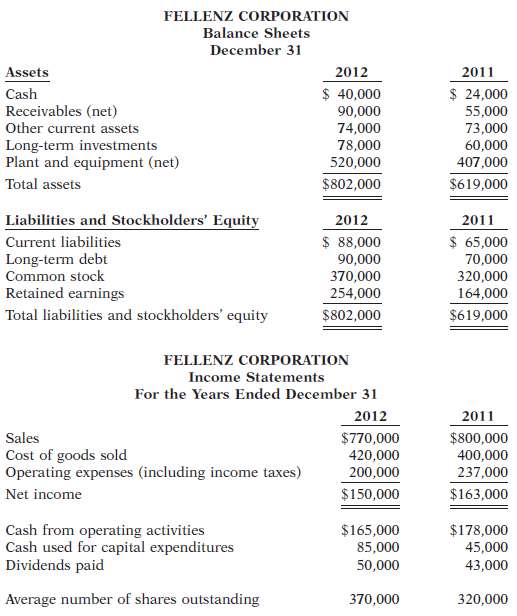
InstructionsCompute the following values and ratios for 2011 and 2012.(a) Earnings per share.(b) Working capital.(c) Current ratio.(d) Debt to total assets ratio.(e) Free cash flow.(f) Based on the ratios calculated, discuss briefly the improvement or lack thereof in the financial position and operating results of Fellenz from 2011 to2012.
FELLENZ CORPORATION Balance Sheets December 31 Assets 2012 2011 $ 40,000 $ 24,000 55,000 73,000 60,000 407,000 Cash Receivables (net) Other current assets 90,000 74,000 78,000 Long-term investments Plant and equipment (net) 520,000 Total assets $802,000 $619,000 Liabilities and Stockholders' Equity 2012 $ 88,000 2011 $ 65,000 Current liabilities Long-term debt Common stock 90,000 70,000 370,000 320,000 Retained earnings Total liabilities and stockholders' equity 254,000 164,000 $802,000 $619,000 FELLENZ CORPORATION Income Statements For the Years Ended December 31 2012 2011 Sales Cost of goods sold Operating expenses (including income taxes) $770,000 420,000 $800,000 400,000 200,000 237,000 $150,000 $163,000 Net income Cash from operating activities Cash used for capital expenditures Dividends paid $165,000 $178,000 85,000 45,000 50,000 43,000 Average number of shares outstanding 370,000 320,000
Step by Step Solution
3.39 Rating (171 Votes )
There are 3 Steps involved in it
2011 2012 a Earnings per share 163000320000 shares 51 150000370000 shares 41 b Worki... View full answer

Get step-by-step solutions from verified subject matter experts
Document Format (1 attachment)
48-B-A-F-S (263).docx
120 KBs Word File