

Question: Consider the following sample: a. Calculate the mean and standard deviation for this data. b. Determine the percentage of data values that fall in each
Consider the following sample:
a. Calculate the mean and standard deviation for this data.
b. Determine the percentage of data values that fall in each of the following intervals:
x̅ ± s, x̅ ± 2s, x̅ ± 3s.
c. Compare these with the percentages that should be expected from a bell-shaped distribution. Does it seem plausible that these data came from a bell-shaped population? Explain.
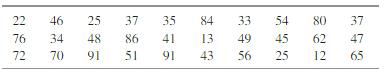
22 46 25 37 35 84 33 54 80 37 76 34 48 86 4 3 49 45 62 47 72 70 91 5 9 43 56 25 12 65
Step by Step Solution
3.48 Rating (158 Votes )
There are 3 Steps involved in it
a b Therefore are respectively 51 2260 51 22260 51 32260 ie 284 736 58 962 and 168 1... View full answer

Get step-by-step solutions from verified subject matter experts
Document Format (1 attachment)
645-M-S-D-A (5348).docx
120 KBs Word File